
A longish thread on RESTARTING ELECTIVE SURGERY for a Saturday morning
First up it is very clear we need to do it
Some patients have life threatening or painful conditions that need addressing.
Provision of healthcare is a must for any civilised society
1/n
First up it is very clear we need to do it
Some patients have life threatening or painful conditions that need addressing.
Provision of healthcare is a must for any civilised society
1/n

The volume of missed surgery is huge
We've probably lost at least 2 million cases in 2020 and we now have a waiting list of about 5 million
Different sources have broadly similar numbers between 2 and 3 million additional cases on the waiting list
2/n
We've probably lost at least 2 million cases in 2020 and we now have a waiting list of about 5 million
Different sources have broadly similar numbers between 2 and 3 million additional cases on the waiting list
2/n


The @RCoANews ACCC Track survey has examined the impact of the pandemic on surgical services
In early December pre the big surge)
nationalauditprojects.org.uk/ACCC-track-Ana…
Many hospitals are unable to undertake elective surgery (red) or struggling (orange)
Space/staff issues most prominent
3/n
In early December pre the big surge)
nationalauditprojects.org.uk/ACCC-track-Ana…
Many hospitals are unable to undertake elective surgery (red) or struggling (orange)
Space/staff issues most prominent
3/n


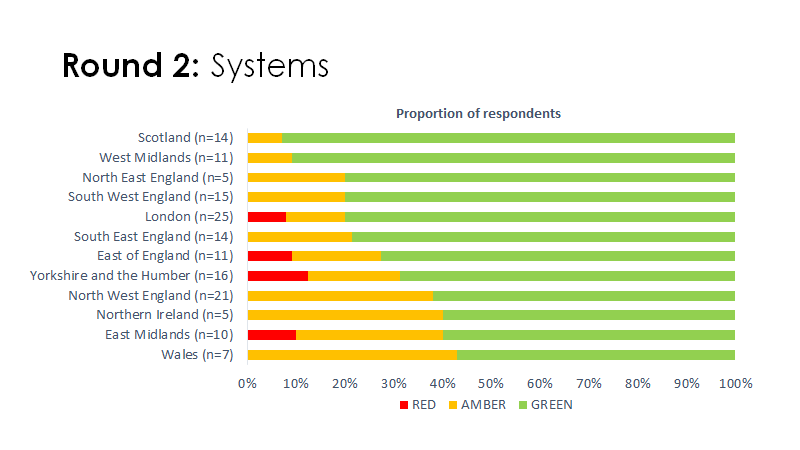
What this translates to is more than 2 in every 3 hospitals were not in a state to do planned surgery
...and this was in early December before the big surge in January
nationalauditprojects.org.uk/ACCC-track-Ana…
4/n
...and this was in early December before the big surge in January
nationalauditprojects.org.uk/ACCC-track-Ana…
4/n

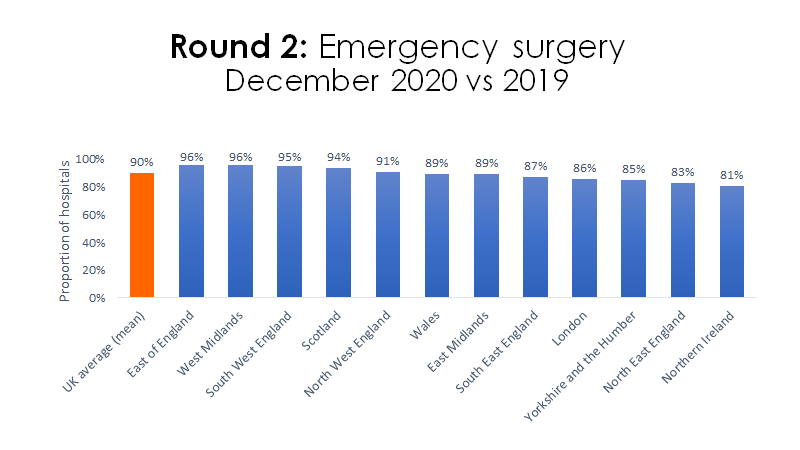
The @RCoANews ACCC Track survey showed the impact on surgery
nationalauditprojects.org.uk/ACCC-track-Ana…
In early December (before the big surge)
Surgery is reduced
-elective non cancer surgery 36%
-children's surgery 35%
-cancer surgery 25%
-emergencies 10%
5/n
nationalauditprojects.org.uk/ACCC-track-Ana…
In early December (before the big surge)
Surgery is reduced
-elective non cancer surgery 36%
-children's surgery 35%
-cancer surgery 25%
-emergencies 10%
5/n


@RCoANews ACCC Track survey showed the overall impact on surgery
nationalauditprojects.org.uk/ACCC-track-Ana…
Cases lost
-a fall of 28% across the board
-5500 each day
-1,000,000 a year
But this is a huge underestimate because
-all surgery stopped in surge 1
-most surgery stopped in Jan-Feb
6/n
nationalauditprojects.org.uk/ACCC-track-Ana…
Cases lost
-a fall of 28% across the board
-5500 each day
-1,000,000 a year
But this is a huge underestimate because
-all surgery stopped in surge 1
-most surgery stopped in Jan-Feb
6/n

So best estimate is we have backlog of >2 million cases
To clear this needs working at
-200% maximum capacity for 1 yr
-140% maximum capacity for 3 yrs
-110% maximum capacity for 10 yrs
Remembering that maximum is maximum!
(& BMA seems to have used the same ideas as me)
7/n
To clear this needs working at
-200% maximum capacity for 1 yr
-140% maximum capacity for 3 yrs
-110% maximum capacity for 10 yrs
Remembering that maximum is maximum!
(& BMA seems to have used the same ideas as me)
7/n


So whichever way we look at it we have a problem in addressing the unmet healthcare needs of 2020
We cannot solve this in a short period
It will require planning, patience and endurance
8/n
We cannot solve this in a short period
It will require planning, patience and endurance
8/n


BUT there are further problems
The pandemic has not finished!
The importance of global vaccination cannot be over emphasised
Without it we risk emergence of variants that evade the vaccine and put us back to square one
9/n
The pandemic has not finished!
The importance of global vaccination cannot be over emphasised
Without it we risk emergence of variants that evade the vaccine and put us back to square one
9/n


This is exactly what happened in Manaus (Brazil)
After widespread infection in wave 1 natural (herd) immunity was at 76%
A new variant emerged and evaded immunity leading to a massive second surge
10/n
After widespread infection in wave 1 natural (herd) immunity was at 76%
A new variant emerged and evaded immunity leading to a massive second surge
10/n


The solutions are global vaccination
To reduce overall transmission and reduce evolutionary pressure on (opportunity for) the virus which leads to new variants
Global efforts are supported by @ACTAccelerator @CEPIvaccines & @gavi
…-publications.onlinelibrary.wiley.com/doi/full/10.11…
11/n
To reduce overall transmission and reduce evolutionary pressure on (opportunity for) the virus which leads to new variants
Global efforts are supported by @ACTAccelerator @CEPIvaccines & @gavi
…-publications.onlinelibrary.wiley.com/doi/full/10.11…
11/n


...& closer to home
The pandemic has not finished!
The rise in hospital work has been enormous & the volume of ICU work extraordinary
-140 temporary ICUs
-staff caring for 2x, 3x 4x normal numbers
-thousands of patients transferred between ICUs
12/n
The pandemic has not finished!
The rise in hospital work has been enormous & the volume of ICU work extraordinary
-140 temporary ICUs
-staff caring for 2x, 3x 4x normal numbers
-thousands of patients transferred between ICUs
12/n


The current fall in hospital and ICU admissions is almost entirely due to lockdown
It takes more time for vaccination to impact on ICU admissions - and even after that patients often stay a month on ICU. We're still busy!
…-publications.onlinelibrary.wiley.com/doi/full/10.11…
13/n
It takes more time for vaccination to impact on ICU admissions - and even after that patients often stay a month on ICU. We're still busy!
…-publications.onlinelibrary.wiley.com/doi/full/10.11…
13/n


The impact on staff
-nurses
-doctors
-all other staff
has been enormous
Physical exhaustion
Untaken holidays
14/n
-nurses
-doctors
-all other staff
has been enormous
Physical exhaustion
Untaken holidays
14/n

But many staff are not just tired
-most are depleted
-many are traumatised
All need rest
Some need help
More than 1 in 3 plan to reduce hours
Almost 1 in 5 may stop working altogether
15/n
-most are depleted
-many are traumatised
All need rest
Some need help
More than 1 in 3 plan to reduce hours
Almost 1 in 5 may stop working altogether
15/n


Numerous organisations are calling out the need for
-a pause
-some rest
-a plan
@RCoANews @FICMNews @AAGBI
@ICS_updates
@TheBMA
Only by doing this will recovery of surgical services be safe, stable and sustainable
16/n
-a pause
-some rest
-a plan
@RCoANews @FICMNews @AAGBI
@ICS_updates
@TheBMA
Only by doing this will recovery of surgical services be safe, stable and sustainable
16/n


The main recommendations from @AAGBI @FICMNews & @RCoANews are here
icmanaesthesiacovid-19.org/towards-safe-s…
17/n
icmanaesthesiacovid-19.org/towards-safe-s…
17/n


Restoration of surgical services is essential
-it should not be rushed into
-it will be a marathon
-global vaccination, allowing staff holidays and psychological support are essential
Just as important innovation & new pathways that will emerge
icmanaesthesiacovid-19.org/towards-safe-s…
18/18
-it should not be rushed into
-it will be a marathon
-global vaccination, allowing staff holidays and psychological support are essential
Just as important innovation & new pathways that will emerge
icmanaesthesiacovid-19.org/towards-safe-s…
18/18

• • •
Missing some Tweet in this thread? You can try to
force a refresh


