I'm working on a statewide project on the minimum wage and what it takes to get by in Pennsylvania. We've got organizations and politicians to speak on this, but what we need are the people willing to tell us how they make ends meet. bit.ly/399BCGG 1/12
The Keystone Research Center estimates that about 26% of Bucks County's workforce would see wages increase if the minimum wage were raised to $15 an hour. That's about 72,000 workers. Over 1.6 million would see an increase statewide. 2/12
This is a very complex issue, though. It's' one thing to ask, "will someone make more?" and quite a different thing to ask "are they making enough to survive?" Let's start with a basic need: shelter. 3/12
Renters occupied over 1.57 million housing units in PA in 2019. Renters made up about 16% of housing units in half the municipalities across the state, according to census estimates. About 22% of Bucks County's 250,522 units are renter occupied. 4/12
The median hourly wage of renter occupied units is actually pretty high in many areas. The median wage of a renter across all towns in PA is around $18.14. The bottom 25% make as much as $14 an hour. That sounds great at first, but it's just the first half a dire equation 5/12
Factoring in the hourly wage needed to cover the median rental values in those towns, nearly 62% of renter occupied homes, or 983,627 units, aren't covering rent in over 700 towns (urban and rural). These estimates are also all before the pandemic economic crisis. 6/12
Rent is a cost most can't control, so low income earners will often cut costs in other necessities like food. That means either going hungry, or using aid programs like SNAP or food pantries. There's still another problem though. bit.ly/3vSkL4J 7/12
SNAP poverty thresholds cap at 130% of the federal poverty threshold for each family size. A 3-person family is capped at $28,200 a year. The average renter makes about $11,000 more than that threshold in PA. Purple towns are where renters make less than the threshold. 8/12
In Bucks, Montgomery and Philadelphia, renters generally make more than that threshold. Even if we used the single-person threshold of $15,880 per year, it doesn't get much easier. A single person or a small family might not qualify for aid in this area 9/12
If this is starting to sound like you, then I'd like to talk to you. Please email me at cullery@couriertimes.com. If this sounds like someone you know, please give them my email address and ask them to consider talking to me for this story. 10/12
Also, in case it comes up, here's FDR's statement on wage standards in 1933: It seems to me to be equally plain that no business which depends for existence on paying less than living wages to its workers has any right to continue in this country. bit.ly/2NLGMBf 11/12
I was bored. So, a relative few number of voters aren't in the same party they were when they voted in November. I mean, we're talking on average 2.29 Democrats have gone Republican and 2.6 Republicans have gone Democrat in municipalities across PA. 1/
We're comparing the total number of GOP to Dem vs Dem to GOP voters. For context, Manheim Township, Lancaster had 77 R_to_D voters and 17 D_to_R voters, for the highest Dem gains of 60 voters. 2/
Interestingly, Democrats going Republican was generally higher in some of the biggest Democratic strongholds. About 144 more Democrats went Republican than the other way around in Philadelphia as of Feb. 1. Bensalem, Bucks County, was second highest with 29 more D to R voters 3/
Last December, a group called @JudicialWatch threatened 19 counties with lawsuits over alleged “extra voters.” Something felt off when I first saw the news release back then. You can read that story here, but I want to revisit thoroughly here. bit.ly/2G4N3jW
JW claimed over 370 U.S. counties had 2.5 million more more voters than people, alleging counties weren’t removing ineligible voters (inactive voters, voters who died, moved, etc.) in accordance with a federal law and inviting voter fraud.
“According to our analysis of data released by the U.S. Election Assistance Commission this year, 378 counties nationwide have more voter registrations than citizens old enough to vote,” the group stated on its website in 2019.
Pennsylvania is banning liquor and beer sales after 5 p.m. on Nov. 25 as part of the state's coronavirus mitigation efforts. The Thanksgiving holiday is projected to take the state into 22,000 new cases daily next month. Let's take stock of where we are... bit.ly/3lTEUCd
Southeastern PA saw some of the highest daily increases as of midnight Sunday. Montgomery's 290 new cases and Bucks' 265 new cases took the second and third highest spots in our top 10 chart here.
Central PA is getting hit hardest though, as far as 14-day average new cases per 100,000 people. Mifflin, Cambria and Juniata counties are among the highest at those rates.
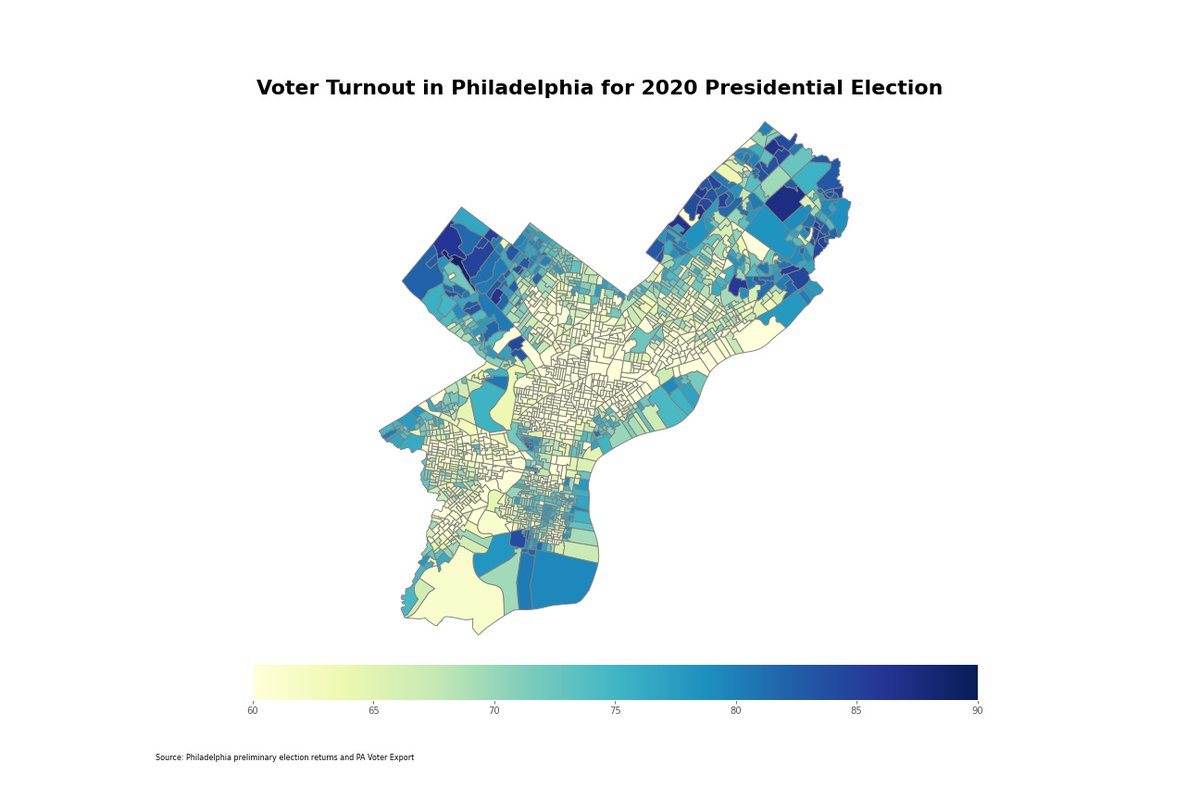
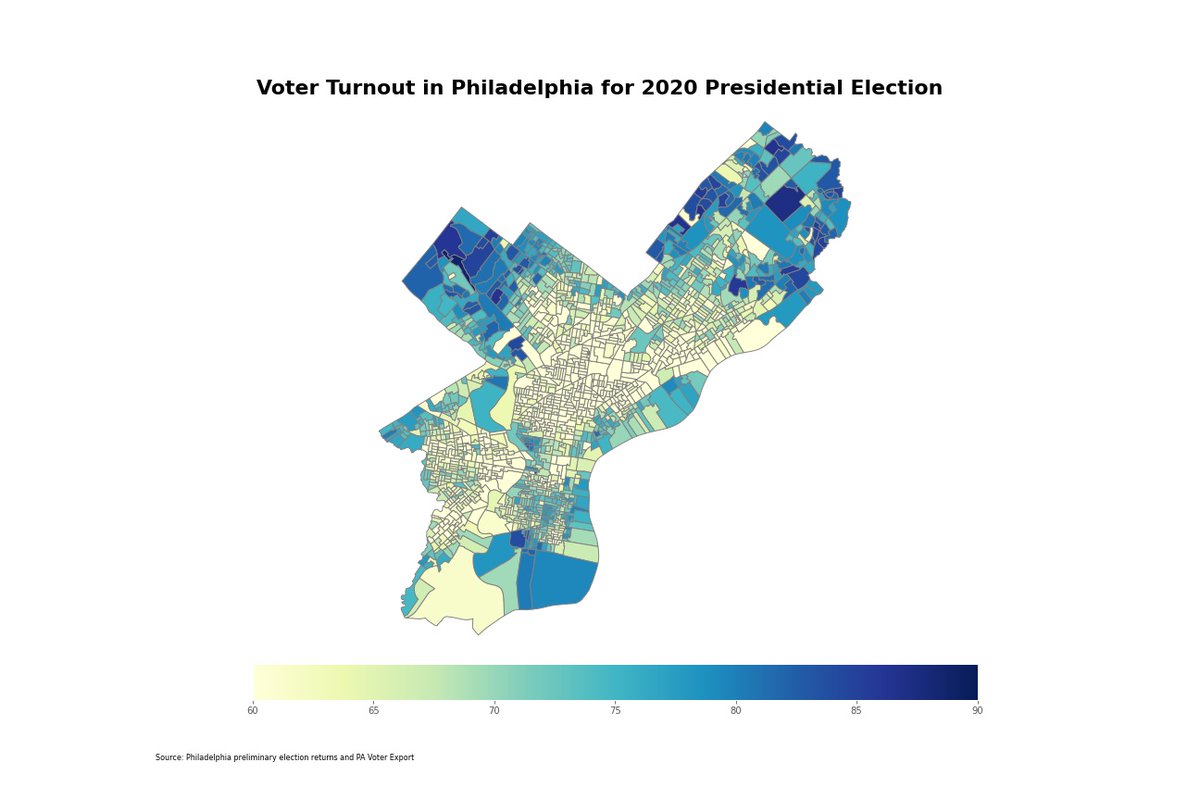
I was curious about voter party turnout in PA, but I'm waiting on a Monday certification deadline. While I'm waiting, I thought I'd take a look at precinct-level data in Philadelphia. There's about 1.12 million registered voters and about 740,000 votes cast in this election
There's about 1,700 voting precincts in the city, with an average turnout of about 65.5%. Highest turnout at a single precinct was 88%, in a precinct at the 21st Ward in northwest Philadelphia.
Philadelphia is a heavily democratic city, with only about 16 precincts having more GOP than DEM voters. That lead is very narrow though, with GOP voters at most having a 15 percentage point lead on Democratic voters (as % of total voters by precinct)
@JoCiavaglia did this very good story about how Bucks County will be reporting its coronavirus figures moving forward. You can read more about that in the link below. More importantly (for me) this gives me an excuse to throw gifs and charts at you!!!! buckscountycouriertimes.com/story/news/202…
As you're all probably aware, #coronavirus cases are way up in Pennsylvania and across the country. It's not just that cases are up, but that we've just about doubled the 14-day average case counts from the peak in April (in Bucks, MontCo and the statewide average).
A line chart is interesting as an overview, but I thought we should go through the past 9 months in a map to really put this in context. Below is the 14-day average case counts of coronavirus per 100k residents in March and April. Southeastern PA quickly becomes the hardest hit.
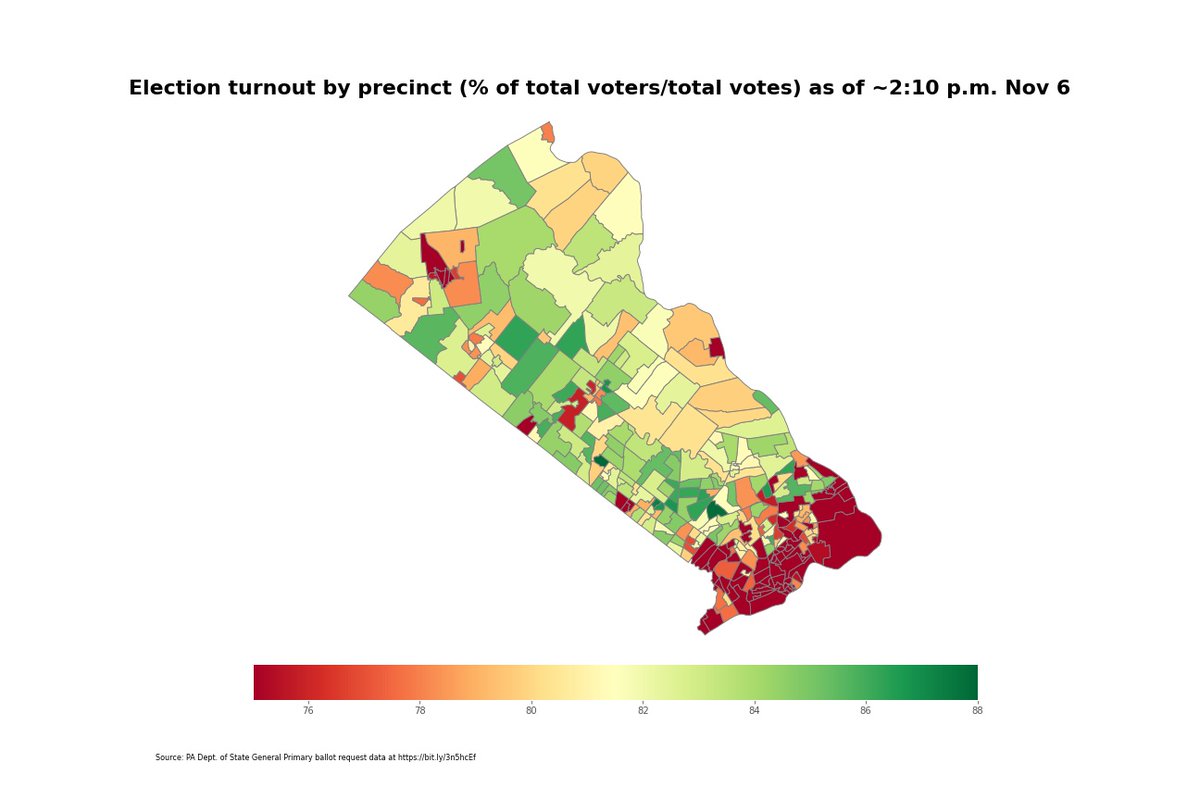
I came across something I think is worth expanding on in Bucks County. Let's start with the overall turnout. As of about 2:10 today, turnout was as high as 88% in some precincts. Turnout averaged about 78% at the precinct level throughout.
Voter turnout was actually lower among districts that had more Democrats than Republican voters. The darkest red areas here show where turnout is under 75% (a bit under the county average).
Turnout in Republican voting precincts was generally higher overall. These districts did contain both the highest and lowest turnout rates, at 53% and 88%, respectively.