1/4
The Ontario Science Table on March 23, published this report essentially recommending AGAINST asymptomatic testing of LTC staff, citing:
-Consistent low %pos of staff in screening
-Vaccination protection of LTC residents
Key observations follow...
covid19-sciencetable.ca/sciencebrief/r…
The Ontario Science Table on March 23, published this report essentially recommending AGAINST asymptomatic testing of LTC staff, citing:
-Consistent low %pos of staff in screening
-Vaccination protection of LTC residents
Key observations follow...
covid19-sciencetable.ca/sciencebrief/r…
2/4
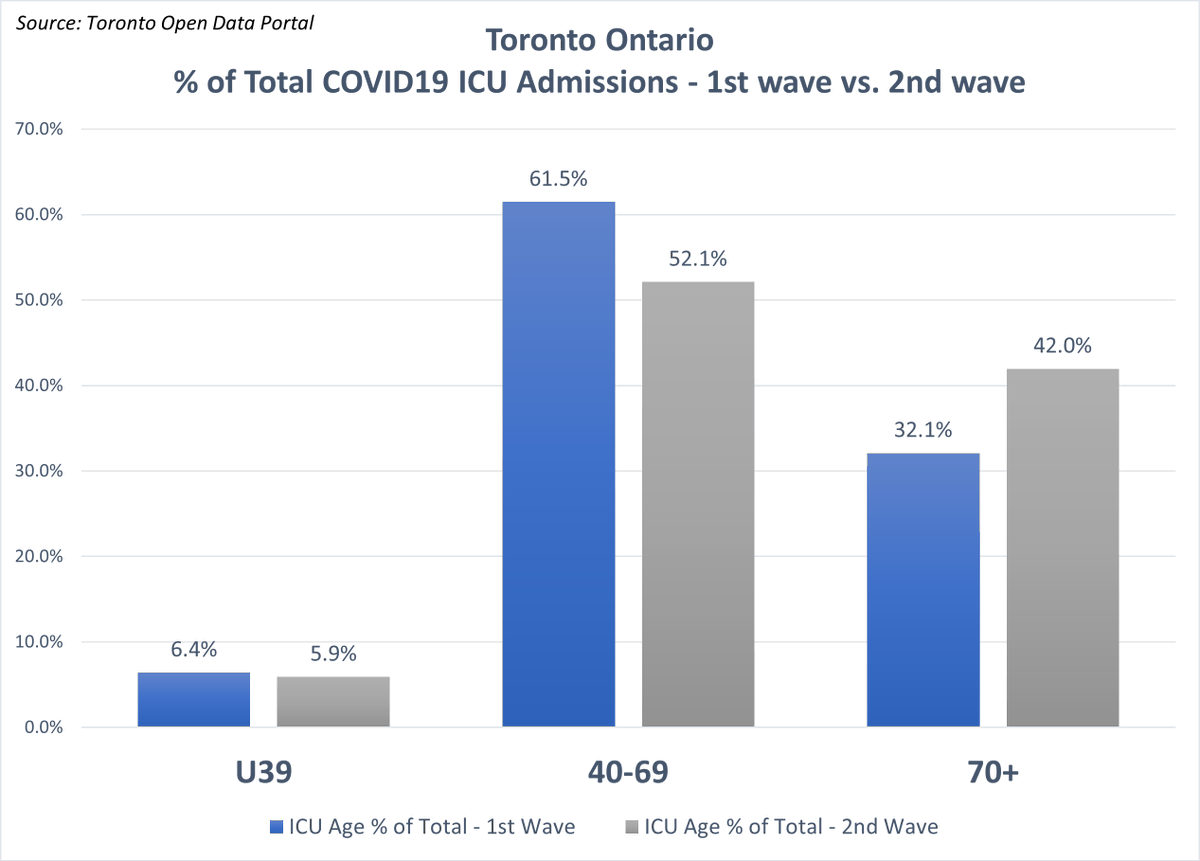
Observation 1
54% of Ontario C19 deaths were among ~80k LTC residents. OST is essentially confirming this population is protected.
Ex-LTC, Ontario C19 deaths =~23 per 100,000 (in line with flu/pneumonia deaths in 🇨🇦).
C19 Survival rate excluding outbreak deaths 70+ =99.2%
Observation 1
54% of Ontario C19 deaths were among ~80k LTC residents. OST is essentially confirming this population is protected.
Ex-LTC, Ontario C19 deaths =~23 per 100,000 (in line with flu/pneumonia deaths in 🇨🇦).
C19 Survival rate excluding outbreak deaths 70+ =99.2%


3/4
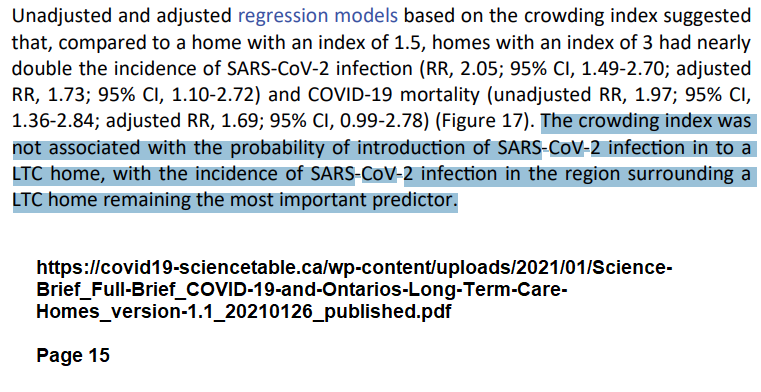
Observation 2
OST indicates/quantifies the extremely low test % positivity of LTC staff in screen testing.
This seems contradictory to the OST conclusion that community incidence of C19 is the key predictor of LTC outbreaks.
Perhaps there is an explanation? cc:@drbobbell
Observation 2
OST indicates/quantifies the extremely low test % positivity of LTC staff in screen testing.
This seems contradictory to the OST conclusion that community incidence of C19 is the key predictor of LTC outbreaks.
Perhaps there is an explanation? cc:@drbobbell

4/4
Lastly, Observation 3
OST essentially recommending against asymptomatic testing for higher risk LTC locations, yet we still continue to asymptomatically test in schools where C19 mortality risk is extremely low.
File under "confusing".
End.
ottawacitizen.com/news/local-new…
Lastly, Observation 3
OST essentially recommending against asymptomatic testing for higher risk LTC locations, yet we still continue to asymptomatically test in schools where C19 mortality risk is extremely low.
File under "confusing".
End.
ottawacitizen.com/news/local-new…
• • •
Missing some Tweet in this thread? You can try to
force a refresh