
och. the stuff i'm looking at today has so many variables and so much variability its about to do me in.
i'm trying to help optimize work in a workload group with a small footprint of concurrent queries and workers while other workload groups are active.
i'm trying to help optimize work in a workload group with a small footprint of concurrent queries and workers while other workload groups are active.
the gray inside the red-dashed-line boxes - that's what i'm trying to help out. without doing unnecessary damage to the other workload groups.
might be a long haul.
might be a long haul.
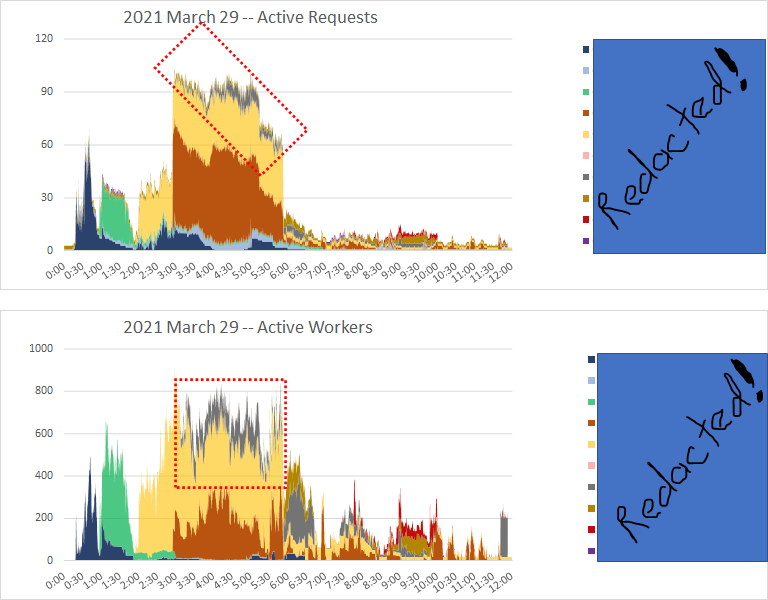
its hard to pick out the CPU utilization for just that workload group from 3 am to 6 am.
and the waits it experiences aren't all that easy to eliminate (memory_allocation_ext waits).
and the waits it experiences aren't all that easy to eliminate (memory_allocation_ext waits).

i have two paths to investigate:
- the effects of foreign memory on memory_allocation_ext waits (two vNUMA node vm each SQLOS memory node tracks over 44GB of foreign memory)
- the effects of multiple simultaneous volatile resource pool memory targets on free memory retention
- the effects of foreign memory on memory_allocation_ext waits (two vNUMA node vm each SQLOS memory node tracks over 44GB of foreign memory)
- the effects of multiple simultaneous volatile resource pool memory targets on free memory retention
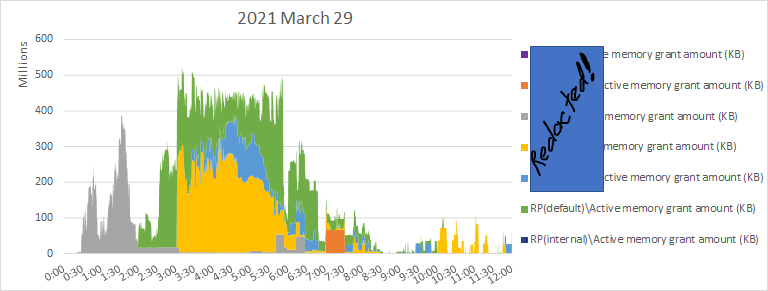
here's the memory on that 2 node system. i don't like seeing all that foreign memory just hanging around. And the sudden, aggressive appearance of free memory is pretty weird.

instance-wide memory

so here's something new for me to stare at: Query Execution Memory Targets for the resource pools on the system. Look at that volatility from 3 am to 6 am.

ok, i took out 3 resource pools just to make this graph a little less busy. line graph of 4 query execution targets against the left axis. area graph of #sqlserver free memory against the right axis.

that's actually the coolest new graph i've made in over a week.
https://twitter.com/sqL_handLe/status/1377043262876348422?s=20
now wait just a dag-burn minute...
this is [Used Memory (kb)] across all 7 resource pools.
this is [Used Memory (kb)] across all 7 resource pools.

that looks an awful lot like the shape of free memory (the light blue area graph below) with some kind of offset...

hmmmm....
not quite but it is soooo tempting...

i know it seems fairly natural to create a resource pool for each workload group. but everything i'm seeing hints to me a system is better off with as few concurrently active resource pools as possible.
ok, ok the *scale* is off but i think the *directionality* is meaningful.
https://twitter.com/sqL_handLe/status/1377058979457679360
after all, a lot of #sqlserver memory management is based off of predictive setting of targets.
which makes me realize there's a ready-made rate available in perfmon that i haven;t consulted yet...
well, memory grants/s is a nothingburger...

that is so much database page read volume to be maintaining a high amount of free memory against...

i think for the time being we're going to have to drop all of these non-default, non-internal workload groups right into the default resource pool in order to start sorting this out.
i use PLE very rarely in my analysis. But the truth of the matter is, maintaining a given PLE with a high read rate and a smaller database cache = a lot of work for the lazy writers.

Look i feel luck as all get-out to have the job i do. it's exquisitely well-shaped to my strengths.
but some days i feel like recommending that these #sqlserver systems use the -x startup option while i make a break for it.
but some days i feel like recommending that these #sqlserver systems use the -x startup option while i make a break for it.

please, please never use the -x startup option in production. it disables almost *every* useful #sqlserver system metric that could be pulled from the DMVs or from perfmon.
i feel like they shuoldn't ever even use it in TPC-H tests because i'd never recommend it for prod use.
i feel like they shuoldn't ever even use it in TPC-H tests because i'd never recommend it for prod use.
yes, i read the TPC-H submissions line-by-line.
i'm no fun at parties.
i'm no fun at parties.
ok, so here's where i go from here:
set the "special gray" workload group to "high importance". That only has meaning compared to other workload groups in the same pool.
recommend consolidate all non-defaul, non-internal workload groups into default resource pool for now.
set the "special gray" workload group to "high importance". That only has meaning compared to other workload groups in the same pool.
recommend consolidate all non-defaul, non-internal workload groups into default resource pool for now.
consolidating activity into default resource pool should eliminate wild fluctution in targets and will hopefully keep this exclusively rowstore system from maintaining a huuge amount of free memory while under tremendous pressure, incurring memory_allocation_ext waits.
i've got an idea to reduce cpu cycles spent on foreign memory - it might even eliminate some of the memory waits. Gotta ask Microsoft about that one.
Dang. I didn't mention this part of the story before, it's a really well-traveled path. This is a 2x21 vm, 42 vcpus. The waits incurred below are with 8 same-size files on 2 Windows volumes.

so tonight this system comes down, and comes back up with 48 same-size tempdb files on those two Windows volumes that used to hold 8 files. That oughtta bring those pagelatch waits wayyyy down.
problem is, even though additional tempdb files will lessen contenion and improve the *system*, i don't think it will improve the "special gray" workload group that is top priority much.
sigh. there is a tiny chance that increasing the tempdb data file count and reducing pagelatch waits will cause more worker threads to slam even harder into memory_allocation_ext waits rather than simply getting more work done and rasing CPU %.
so there's a chance that this very standard performance intervention could be a net loss for system performance.
but it could happen the other way around, too. Eliminating memory_allocation_ext waits could cause even more threads to slam into pagelatch waits.
i'm never sure of the correct order of operations on complex systems until after the fact.
i'm never sure of the correct order of operations on complex systems until after the fact.
i remember more ~8 years ago i was on a site trip for work. pretty sure @SQLGoddess was there, too.
trying to get thru as many meaningful performance interventions to turn around a system.
trying to get thru as many meaningful performance interventions to turn around a system.
could tell they were racking up spinlocks and that trace flag 8048 would help.
also could tell that many query plans were suboptimal and based on experience with plans for that type of analytics queries, i expected trace flag 4199 to improve many plans.
but which to put in first?
also could tell that many query plans were suboptimal and based on experience with plans for that type of analytics queries, i expected trace flag 4199 to improve many plans.
but which to put in first?
i reasoned that improved query plans was a more "accessible" performance intervention, so we'd implement that one first, verify the benefit, then implement trace flag 8048.
sigh. wrong move. "better" plans but same spinlock contention lead to CPU utilization so high with such long runnable threads list on each logical processor *nothing* could connect anymore. not even the monitoring system. my performance fix had made their system unresponsive.
or rather, the order i selected for the performance interventions.
if trace flag 8048 and 4199 had gone in together, woulda been fine (but we wanted separation for validation).
if trace flag 8048 had gone in first, the 4199 woulda been fine. hindsight.
if trace flag 8048 and 4199 had gone in together, woulda been fine (but we wanted separation for validation).
if trace flag 8048 had gone in first, the 4199 woulda been fine. hindsight.
but after that experience - which fortunately was recovered from fairly quickly and trace flag 8048 put in place post-haste - i learned some new considerations for putting interventions in the right order.
so when issues like this came up...
with a potential mitigation of using trace flag 8015 *if* all logical CPUs were in a single processor group...
~~
#sqlserver 2008 R2 SP2 CU0
KB2819662 - FIX: SQL Server performance issues in NUMA environments
support.microsoft.com/en-us/topic/kb…
with a potential mitigation of using trace flag 8015 *if* all logical CPUs were in a single processor group...
~~
#sqlserver 2008 R2 SP2 CU0
KB2819662 - FIX: SQL Server performance issues in NUMA environments
support.microsoft.com/en-us/topic/kb…
i knew enough to think through that trace flag 8048 mitigated contention among workers in a single SQLOS memory node... and that trace flag 8015 forced workers that would otherwise have been in separate memory nodes into a single memory node...
so that if trce flags 8015 and 8048 were to be implemented on the same system 8048 should precede 8015 is they don't both go in at the same time.
otherwise 8015 would just amp up the spinlock contention.
otherwise 8015 would just amp up the spinlock contention.
that's old news now, though. #sqlserver 2016++ dynamic memory object partitioning has all but eliminated any meaning for trace flag 8048.
and i don't recommend trace flag 8015 anymore due to the single processor group enforcement and other memory management considerations.
and i don't recommend trace flag 8015 anymore due to the single processor group enforcement and other memory management considerations.
OK. a workload group can only be moved from one resource pool to another when it has no active requests. so throughout the day tomorrow we'll execute this until all the workload groups are in the default resource pool.

#sqlserver query execution memory targets are really volatile across resource pools when multiple pools are simultaneously active.

those highly volatile #sqlserver QE targets are negatively correlated to the amount of free memory retained.
that may be an unintended consequence.
that may be an unintended consequence.

previously i was fretting whether increasing tempdb data files file count first would lead to an -order-of-operations issue while trying to improve performance.
nope, it was a good first step.
nope, it was a good first step.
https://twitter.com/sqL_handLe/status/1377096460228038658
• • •
Missing some Tweet in this thread? You can try to
force a refresh


