@glukianoff@JonHaidt The Pew panel survey included the negative mental health symptoms battery in a subsequent wave (1 month later). Here were the results
@glukianoff@JonHaidt The latest ANES Time Series survey included only 2 mental health items (restlessness, trouble concentrating), but the substantive pattern is replicated notwithstanding. I will graph the results and share.
@glukianoff@JonHaidt As promised, here are the mean responses to the two items by ideology. White vs. non-white differences were insignificant here, so I didn't bother to graph them.
@glukianoff@JonHaidt I also averaged the two items and z-scored the index. Here are the results by ideology x sex.
@glukianoff@JonHaidt I'll need to conduct a more rigorous analysis when I have more time, but the differences are large enough that I suspect they'll survive any controls.
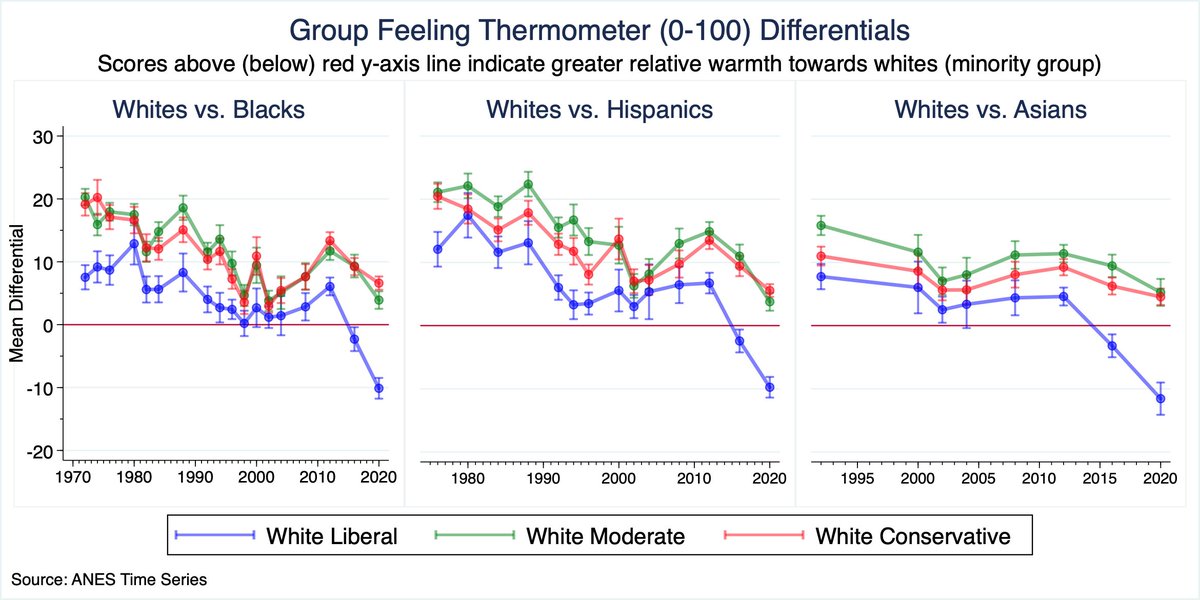
1/n Updated whites vs. racial/ethnic outgroup feeling thermometer differential scores. Among white liberals, the average differential further widened (in the pro-outgroup/anti-white direction) by about 7 points between 2016-2020, while the small pro-white differential among...
2/n white mods and conservatives narrowed.
Below you have the average differential (among white respondents) for 2020 across the complete 7-point ideology scale. 'Very liberal' now rate racial/ethnic minorities nearly 22 (!) points more warmly than they do whites.
3/n Also worth noting that some of these changes are due to increases in the proportion that give outright negative (< 50) ratings of whites. In fact, the 2020 proportion of 'anti-white' white liberals (~11%) is the highest on record.
1/n Latest ANES data shows that ~42%, 34%, and 30% of white liberals now report regularly getting news from the NYT, Washington Post, and CNN (website) respectively--which is up from 18%, 6%, and 16% in 2012.
2/n Across this same period, the % of white conservatives who reported regularly getting news from FoxNews.com jumped from 15% (2012) to 26% (2020).
3/n These data are generally consistent with what I previously observed in similar Pew data
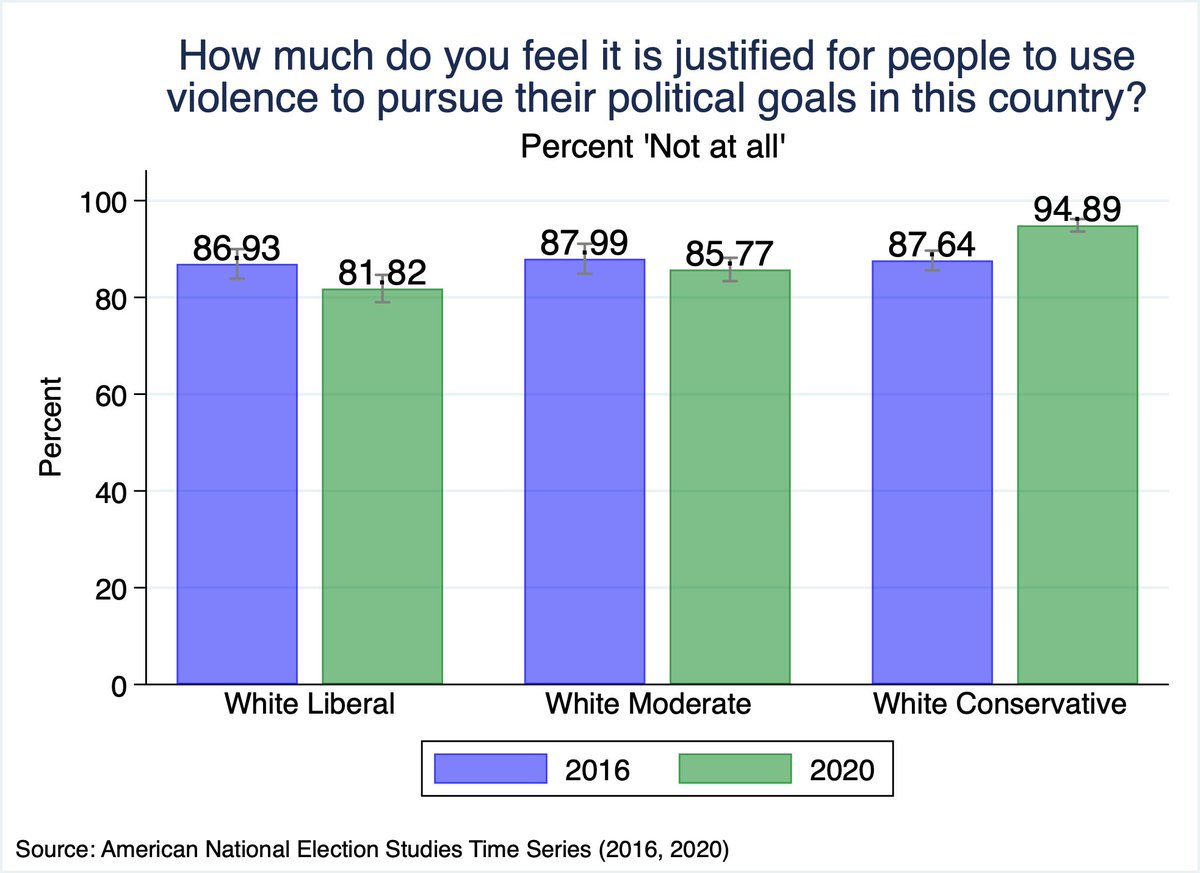
1/n Between 2016-2020, white liberals became slightly but significantly less likely to say that political violence is 'not at all' justified, while white conservatives became significantly more likely to give this response.
2/n By party, we see a small drop among Dems and a slightly larger increase among Reps
3/n Virtually all of the decrease among Dems is attributable to White Dems
This one suggests that greater trust in news media --> greater overestimation of the percent of people killed by police in 2019 who were black + greater likelihood of thinking that police...
2/n ...are more violent today than they used to be
3/n Partisanship/ideology is an obvious confound here (i.e. dems/liberals more likely to trust the media AND overestimate).
1/n A sizeable body of literature in the political sciences contends that female political candidates are disadvantaged by voter sexism. But, as @LJZigerell and I argue in a recent paper (linked in the final tweet), the measure of sexism on which this conclusion often rests..
2/n ...also shows that male candidates are penalized by a pro-women or anti-male bias. To explain, here is a version of the 'modern sexism' scale that is often featured in this line of research.
3/n The very title of the scale seems to imply (and is often interpreted as such) that it runs from 'non-sexist' at the low end to 'sexist' at the high end. But, as LJ and I point out, the scale actually appears to range from 'anti-male' to 'anti-female'.
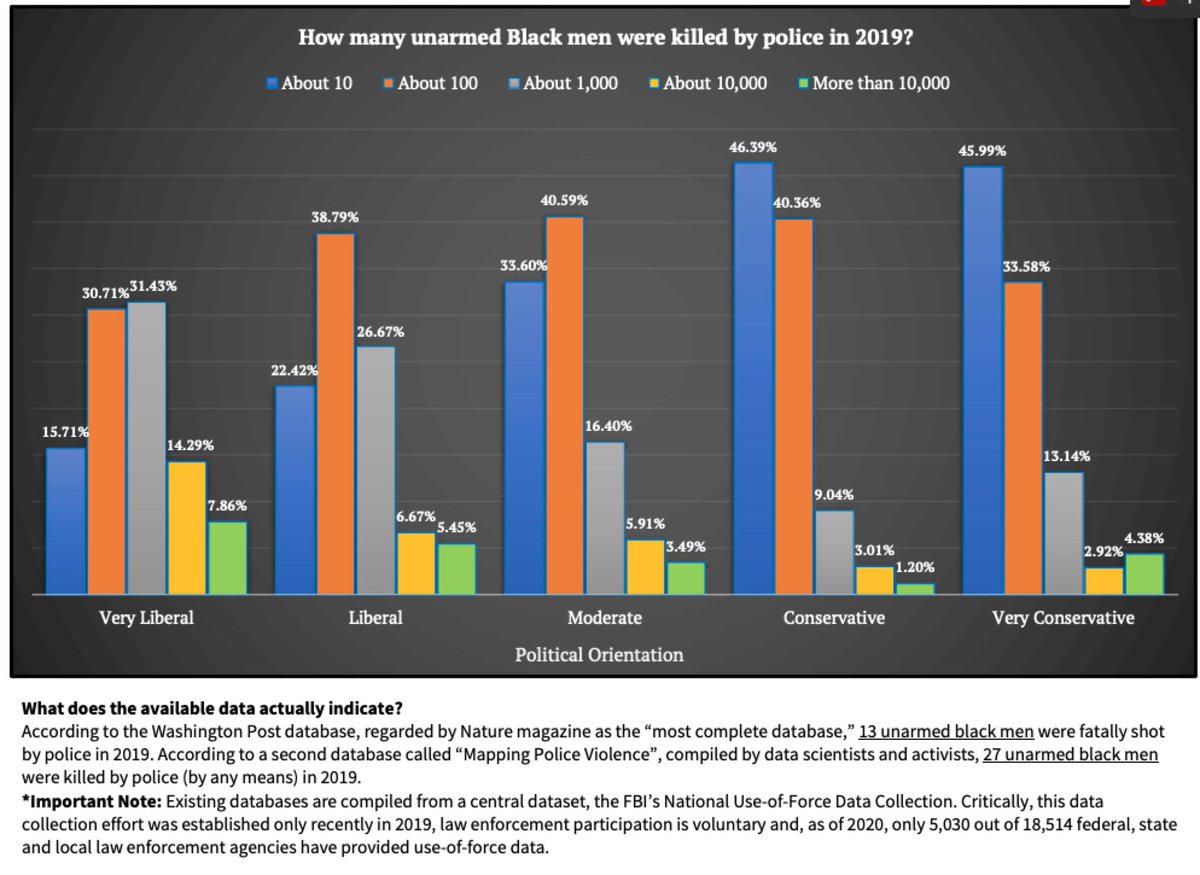
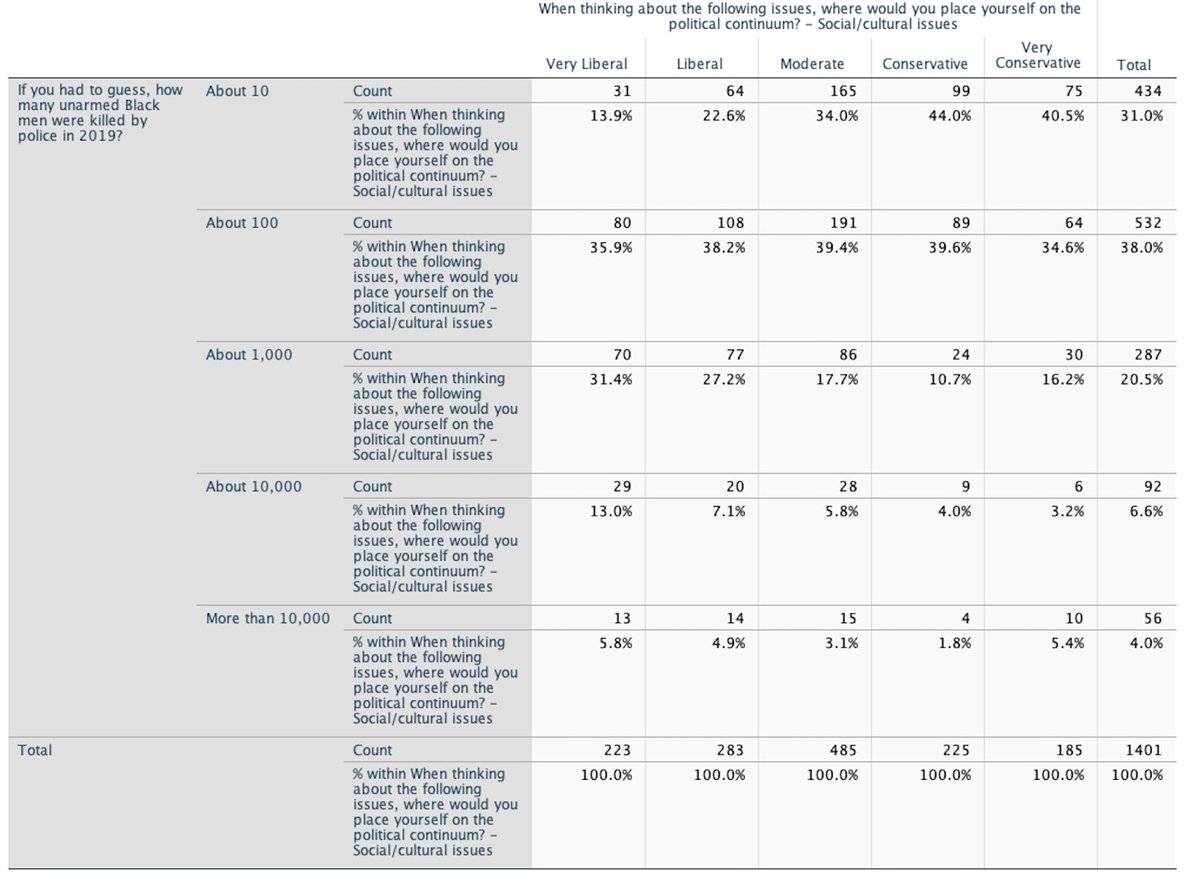
1/n A recent nationally representative survey commissioned by Skeptic Mag asked respondents to estimate the number of unarmed blacks killed by police in 2019. Overall, 44% of liberals guessed 1,000 or more as compared to 20% of conservatives (this calculation is based on the..
...cross-tabs shared with me by the researcher)
3/n According to the Mapping Police Violence database, the actual figure is 27.