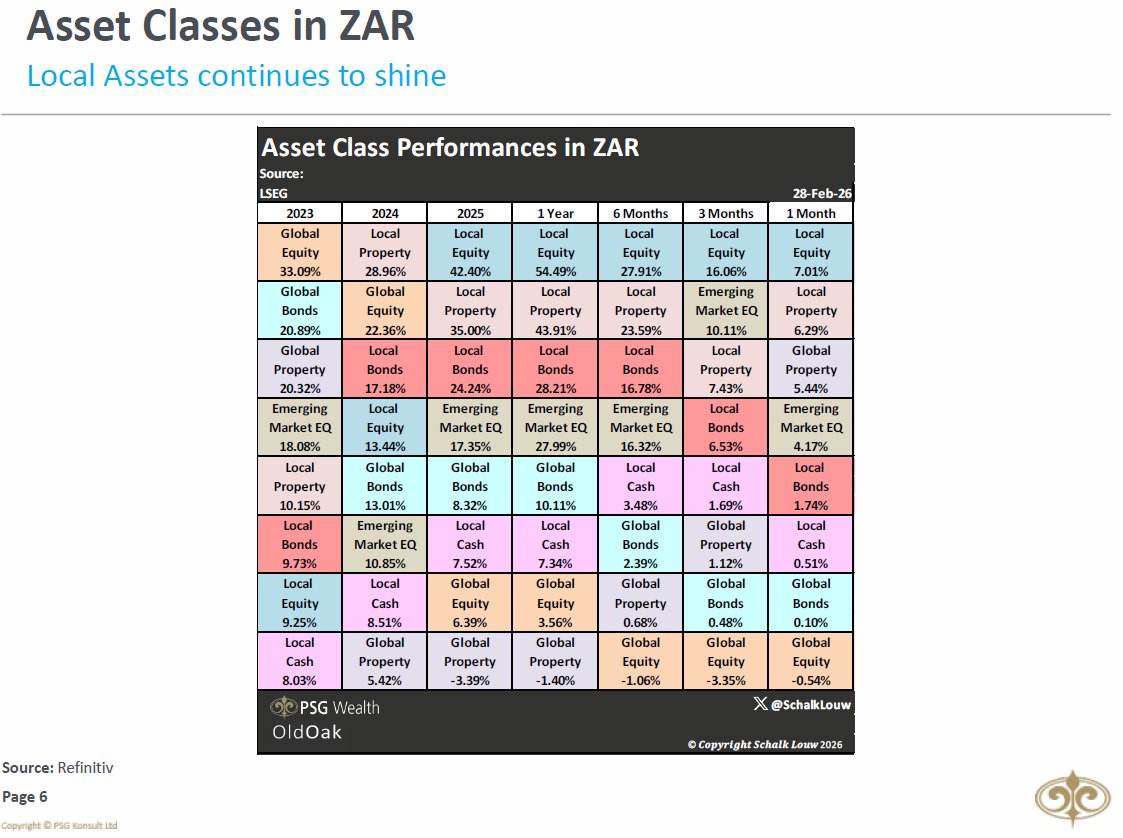
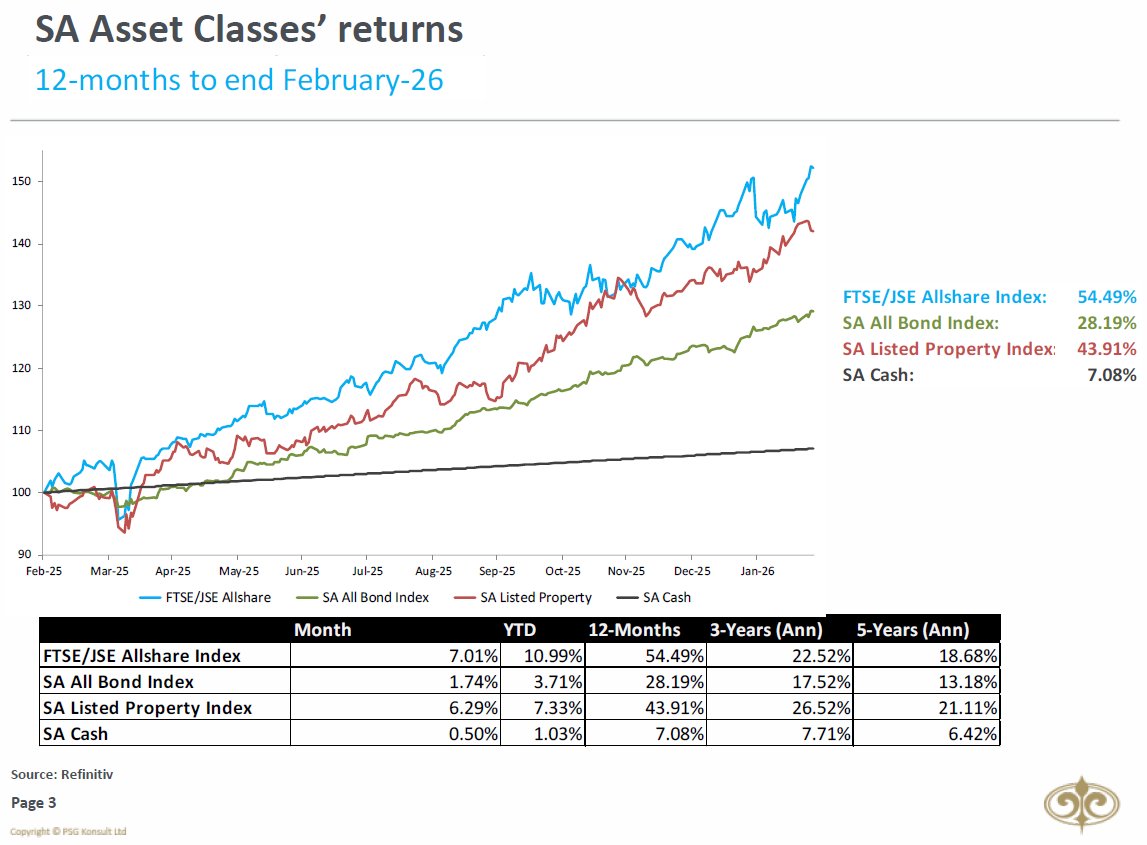
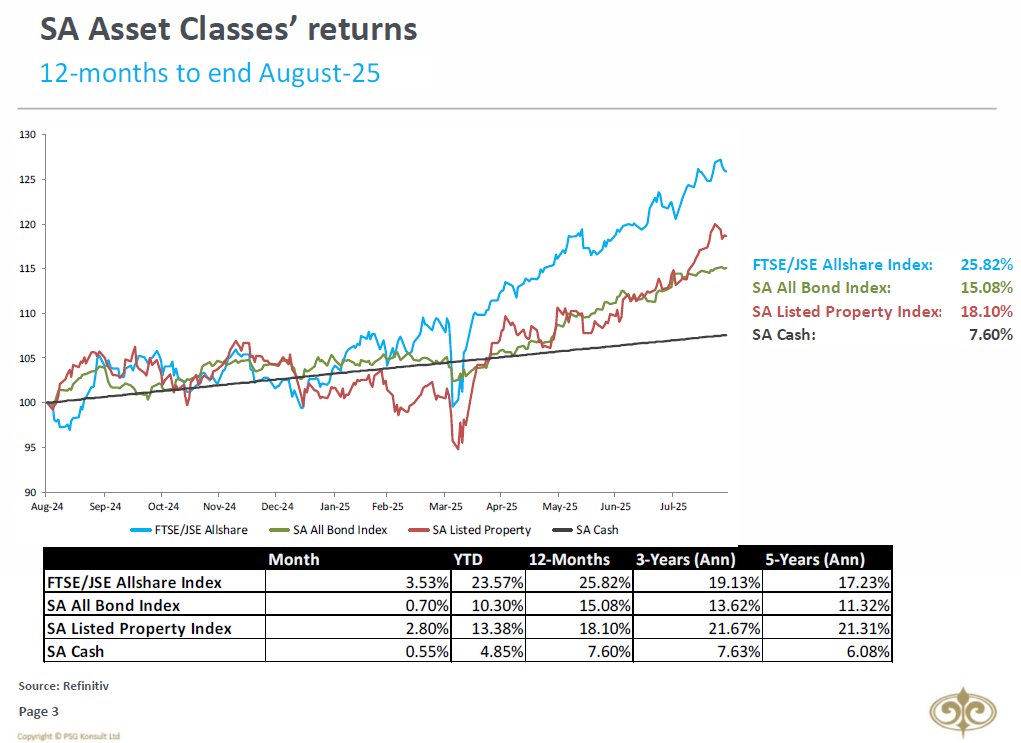
UPDATE ON MARKETS: Man! I'm glad I didn't advice investors to cash in all they're local equity investments a year ago to invest abroad. #JSE improved by 1.6% during March, bringing 12-month returns to 54%. SA Property followed by gaining 1.2%, while the SA Bonds decreased 2.5%. 

Page 2/9
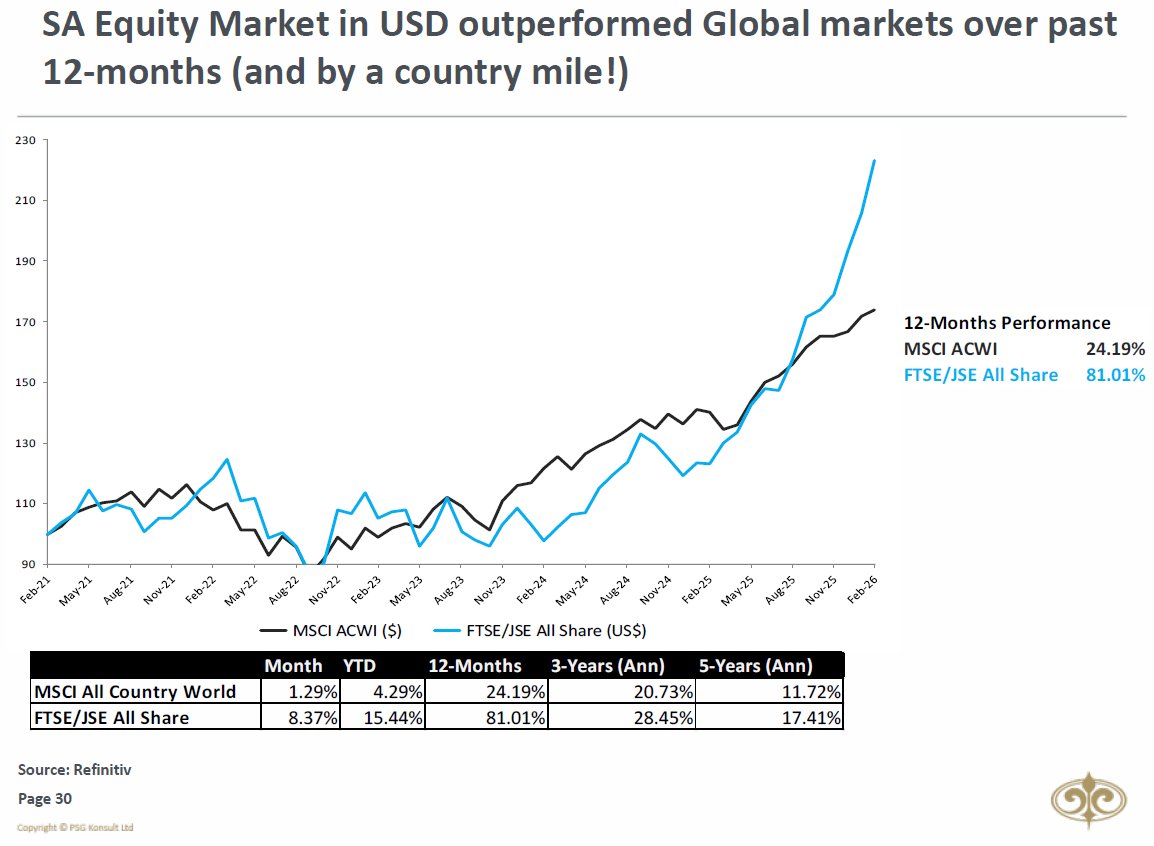
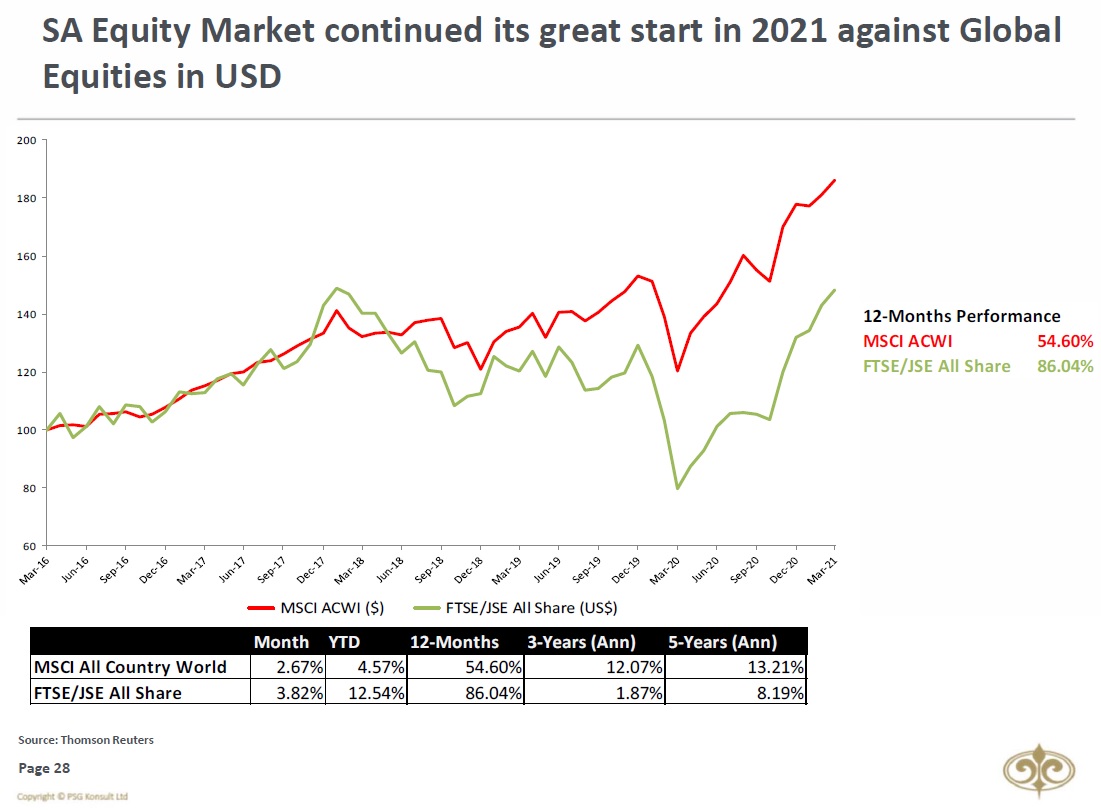
The FTSE/ JSE All Share (+3.82%) again enjoyed a much better month than the MSCI All Country World Index (+2.67%) again in USD terms. The 12-month performance for the JSE in USD-terms still leads the MSCI ACWI’s performance by nearly 32%. Wow!
The FTSE/ JSE All Share (+3.82%) again enjoyed a much better month than the MSCI All Country World Index (+2.67%) again in USD terms. The 12-month performance for the JSE in USD-terms still leads the MSCI ACWI’s performance by nearly 32%. Wow!
Page 3/9
South African Small Caps again dominated during March, growing by 7.7%. Large Caps and Mid-Caps grew by 1.3% and 3.4%, respectively.
South African Small Caps again dominated during March, growing by 7.7%. Large Caps and Mid-Caps grew by 1.3% and 3.4%, respectively.

Page 4/9
Foreigners returned as net buyers of South African Equities in March. They were however net sellers of local bonds, which might be contributed to the higher US Yields.
Foreigners returned as net buyers of South African Equities in March. They were however net sellers of local bonds, which might be contributed to the higher US Yields.

Page 5/9
From a sectoral point of view, March saw the Sectors very evenly matched.
From a sectoral point of view, March saw the Sectors very evenly matched.

Page 6/9
The Rand’s value AGAIN strengthened by 2.2% against the USD. This was a positive move as ALL other BRICS currency movements weakened against the USD. This helped the Rand to further extend its lead as best performing BRICS currency position over a 5-year period.
The Rand’s value AGAIN strengthened by 2.2% against the USD. This was a positive move as ALL other BRICS currency movements weakened against the USD. This helped the Rand to further extend its lead as best performing BRICS currency position over a 5-year period.

Page 7/9
The US M2 Money Supply YoY growth rate reached a new all-time high for the tenth time since early 2020.
The US M2 Money Supply YoY growth rate reached a new all-time high for the tenth time since early 2020.

Page 8/9
The US Dollar Index broke above its 200-day Moving Average, with the 50-day moving closer and closer to the 200-day. Will be monitoring a possible Golden-cross in April, which could be positive for the USD technically.
The US Dollar Index broke above its 200-day Moving Average, with the 50-day moving closer and closer to the 200-day. Will be monitoring a possible Golden-cross in April, which could be positive for the USD technically.

Page 9/9 & final
Most commodities took a breather in March. Brent Oil was the biggest loser, losing 3.9%. Palladium however bucked the trend, by gaining a whopping 11.1% over the same period.
HAPPY EASTER EVERYONE!
Most commodities took a breather in March. Brent Oil was the biggest loser, losing 3.9%. Palladium however bucked the trend, by gaining a whopping 11.1% over the same period.
HAPPY EASTER EVERYONE!

Unroll @threadreaderapp
• • •
Missing some Tweet in this thread? You can try to
force a refresh