Schalk Louw | Mr Louwcal 🇿🇦 Profile picture
Portfolio manager & Strategist at @PSGInvest. Passionate about my family & investments. Tweets are not advice & are independent of my employer. Local is Lekker!
Nov 1 16 tweets 6 min read
UPDATE ON MARKETS: Relative to broader asset classes globally, Local Equities continue to lead strongly over the short and longer term. Local Bonds and Local Property have also delivered competitive performance, while Global Property remain weaker across multiple timeframes.

🧵 Image 2/16

FTSE/JSE All Share delivered a 1.6% gain, SA Bonds up 2.6%, SA Listed Property surged by 7.84% (best local asset class for the month), while SA Cash remained stable at 0.6%. On a 12-month basis, both Property (23.6%) and Bonds (20.1%) continued to outperform Cash (7.4%). Image
Sep 1 15 tweets 6 min read
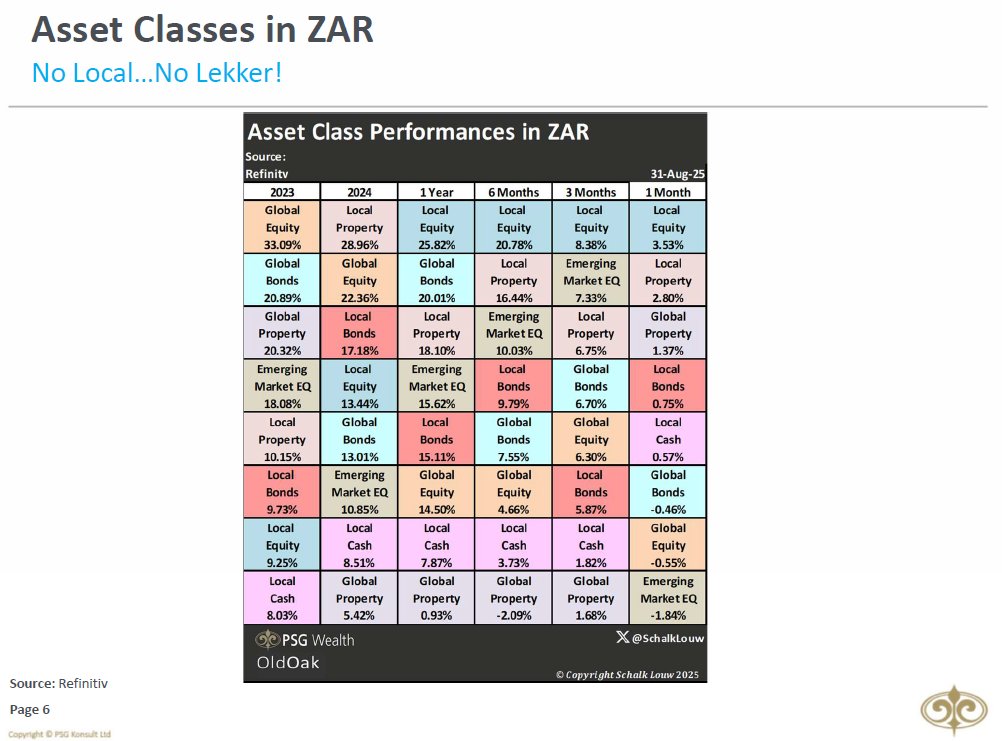
UPDATE ON MARKETS: Local assets continue to shine, with four of the five best-performing asset classes being South African. In short: no local, no lekker this August.

🧵 Image 2/15

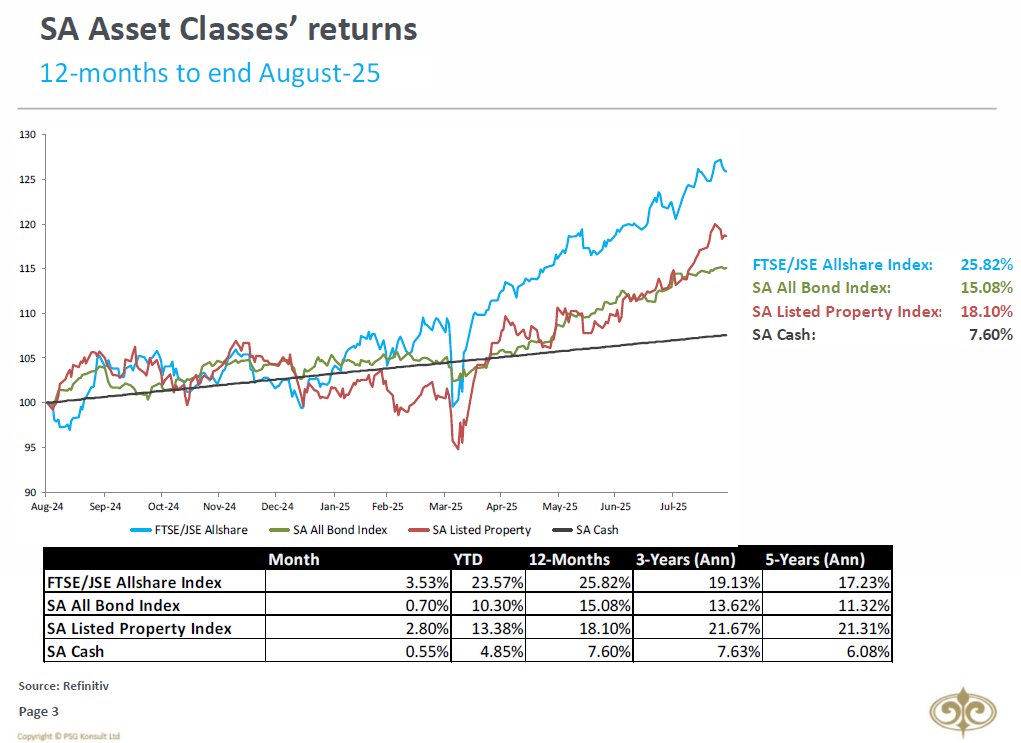
In August, the FTSE/JSE All Share (JSE) advanced by 3.53%, lifting the 12-month return to a strong 25.82%. SA Bonds gained 0.70%, SA Listed Property rose 2.80%, while SA Cash returned 0.55%. Image
Jun 1 15 tweets 6 min read
UPDATE ON MARKETS: Locally, the South African Reserve Bank lowered the repo rate by 0.25% in May — a move that certainly brought renewed optimism to the markets. Local remained lekker for 2025. Image 2/15

In May, the FTSE/JSE All Share (JSE) rose by 3.14%, bringing the 12-month return to an impressive 27.30%. Local Bonds returned 2.70%, while SA Listed Property gained 2.32%. SA Cash continued to offer a steady 0.59% monthly return. Image
Aug 1, 2023 15 tweets 6 min read
UPDATE ON MARKETS: FTSE/JSE All Share demonstrated another impressive performance in July, outperforming the MSCI All Country World Index. JSE recorded a 4.01% increase, while South African bonds (ALBI) & the local property market improved by 2.29% and 2.3%, respectively in July. Image 2/15

The JSE experienced a significant surge in July, gaining 9.7% in USD value. Comparatively, the MSCI All Country Index had a more modest growth of 3.66%, while the MSCI Emerging Markets Index witnessed a 6.22% increase. Image
Nov 6, 2022 19 tweets 26 min read
THREAD: A picture is worth a thousand words. Let's look at a few of the globe's largest #ETF's & their graphs & see if we can make some sense of the current market environment.

What a year it's been for #Oil & #Energy! Only positive YTD #MSCI #Sector.

$IXC 2/19

#Global #CleanEnergy #ETF relative to Global #Energy shows an interesting picture.

$ICLN vs $IXC
Jan 29, 2022 16 tweets 21 min read
THREAD: A picture is worth a thousand words. Let's look at a few #ETF graphs & see if we can make some sense of the current market environment.

What a year it's been for #Oil & #Energy! Sharing only positive YTD #MSCI #Sector performance with #Financials.

$IXC $IXG 2/15

#EmergingMarkets #ETF seriously lagging #DevelopedMarkets ETF, mostly due to disinvestment from #China.

#SouthAfrica might need a lot of catch up, but $EZA 1YR performance in USD (+9.9%) is still ahead of $EEM (-11.3%)

$URTH
Jan 1, 2022 11 tweets 4 min read
UPDATE ON MARKETS: Happy New Year, everyone. The South African market ended 2021 with its best performance in 12 years. FTSE/JSE All Share increased by 4.8% during December, SA Property stocks increased by 7.88% in December, while SA All Bond Index improved 2.69% for the period. 2/10

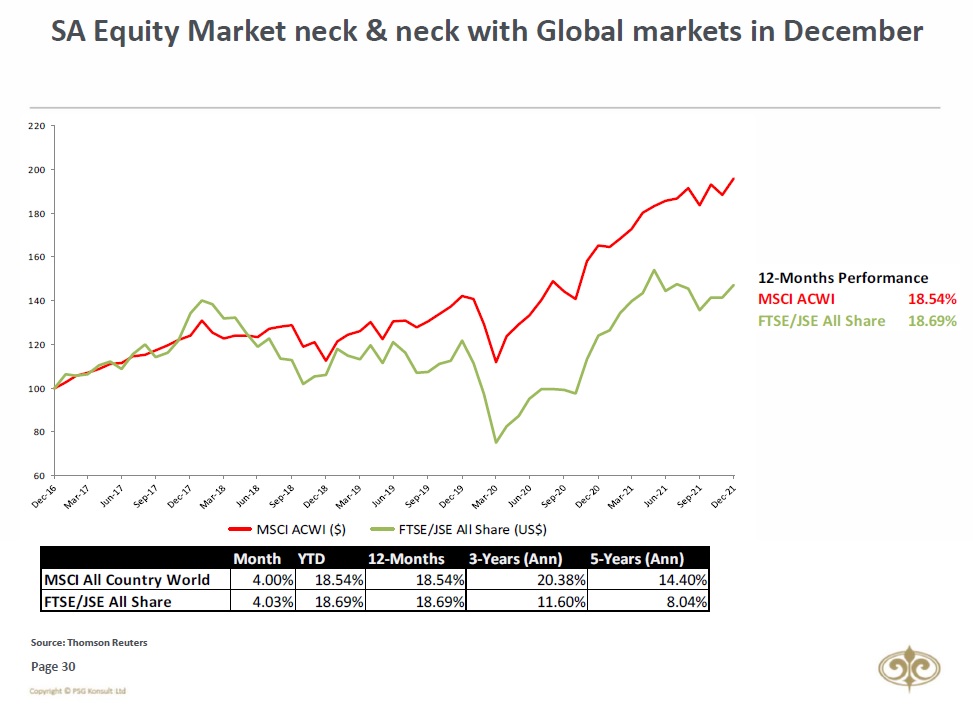
FTSE/ JSE All Share (+4.03%) in USD, performed in line with MSCI All Country World Index (+4.00%), while MSCI Emerging Markets Index (+1.88%) again lagged both these indices. The 12-month performance for JSE in USD terms was also in line with the MSCI ACWI’s performance.
Aug 27, 2021 13 tweets 18 min read
#Global #ETF (thread): 26 Aug 2021

- 2020 worst perf #sectors making still leading in 2021 $IXG $IXC

- This is helping #oil producing countries with #SaudiArabia & #UAE in top5 #Country ETF YTD performers in USD $KSA $UAE

- #SouthAfrica $EZA still in top30 YTD performers 2/12

#EmergingMarkets #ETF seriously lagging #DevelopedMarkets ETF, mostly due to disinvestment from #China.

#SouthAfrica might need a lot of catch up, but $EZA YTD performance in USD (+8.2%) is still ahead of $EEM (-0.95%)
Jul 1, 2021 10 tweets 4 min read
UPDATE ON MARKETS: BIG breather from all things SA. FTSE/JSE All Share retracted by 2.4% during June, bringing year-to-date returns to 13.2%. SA Property stocks had a great recovery, increasing 3.4%. Despite having net foreign selling pressure, SA All Bond Index increased by 1.1% 2/9

Massive underperformance by the FTSE/ JSE All Share (-6.2%) versus the MSCI All Country World Index (+1.32%) in USD-terms. The 12-month performance for the JSE in USD terms still leads the MSCI ACWI’s performance by nearly 13%.
Jun 1, 2021 10 tweets 4 min read
UPDATE ON MARKETS: FTSE/JSE All Share improved by another 1.6% during May, bringing the year-to-date returns to 16.02%. SA Property stocks took a breather after a MASSIVE recovery during April by declining by 2.9% in May. The SA All Bond Index increased by 3.7% for the period. 2/9

The FTSE/ JSE All Share (+7.30%) had a much stronger month than the MSCI All Country World Index (+1.56%) again in USD-terms. The 12-month performance for the JSE in USD-terms still leads the MSCI ACWI’s performance by nearly 35%.
May 2, 2021 10 tweets 4 min read
UPDATE ON MARKETS: The FTSE/JSE All Share (JSE) improved by 0.97% during April, bringing the 12-month returns to 36.4%. SA Property stocks (SAPY) saw a MASSIVE recovery during April by gaining 11.68%, while the SA All Bond Index decreased by 1.9% for the period. 2/9

The FTSE/ JSE All Share (+2.84%) had a slower month than the MSCI All Country World Index (+4.37%) in USD terms. It did however managed to outperform the MSCI EM (2.49%). The 12-month performance for the JSE in USD terms still leads the MSCI ACWI’s performance by nearly 30%.
Apr 1, 2021 10 tweets 4 min read
UPDATE ON MARKETS: Man! I'm glad I didn't advice investors to cash in all they're local equity investments a year ago to invest abroad. #JSE improved by 1.6% during March, bringing 12-month returns to 54%. SA Property followed by gaining 1.2%, while the SA Bonds decreased 2.5%. Page 2/9

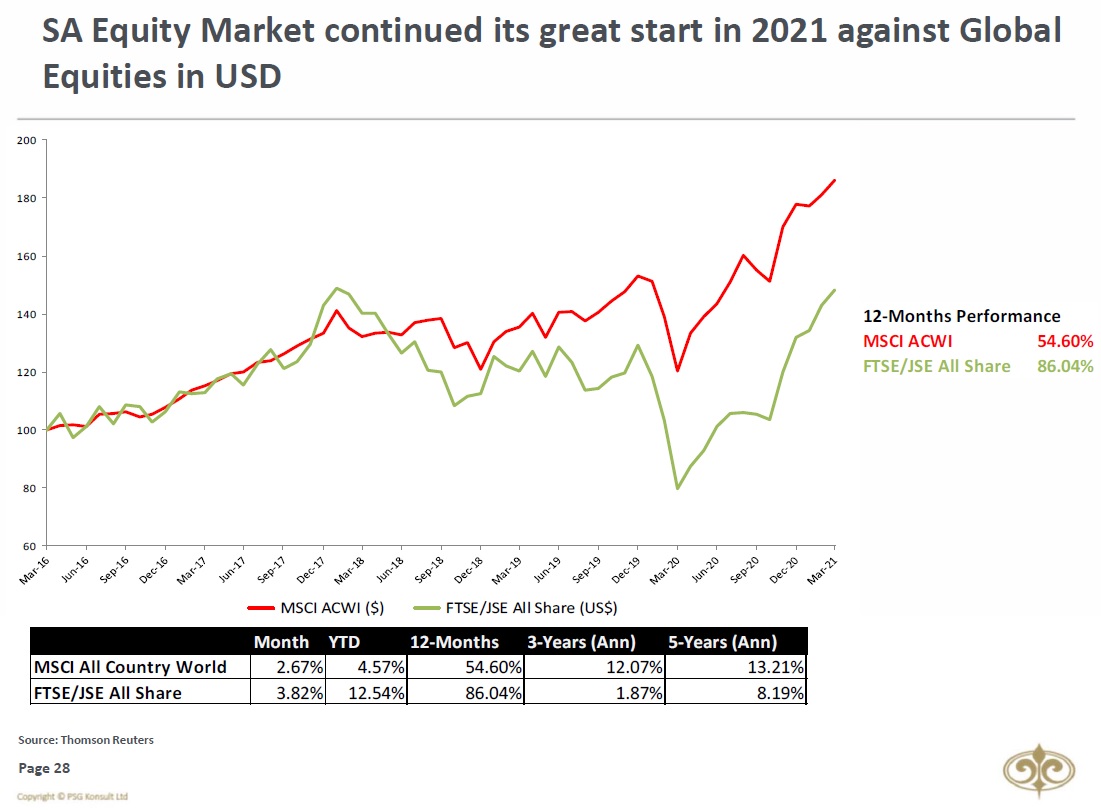
The FTSE/ JSE All Share (+3.82%) again enjoyed a much better month than the MSCI All Country World Index (+2.67%) again in USD terms. The 12-month performance for the JSE in USD-terms still leads the MSCI ACWI’s performance by nearly 32%. Wow!
Feb 28, 2021 19 tweets 22 min read
Anybody feels like looking at a few #Global #ETF graphs? Or are you all sitting in front of a big fire, ready for that Sunday braai or potjie?

If there's interest, I'll be happy to show 1 graph for every like or retweet?

#MonthEnd #Markets That's nr1 (5 likes & retweets). Nice one @RocknDad 😂- saw you sneak in both a like & retweet, but rules are rules.

#SouthAfrica dropping down to 10th in the #Country #ETF YTD rankings. #China losing the lead to #Taiwan. #Brazil new current holder of the wooden spoon.
Feb 1, 2021 13 tweets 6 min read
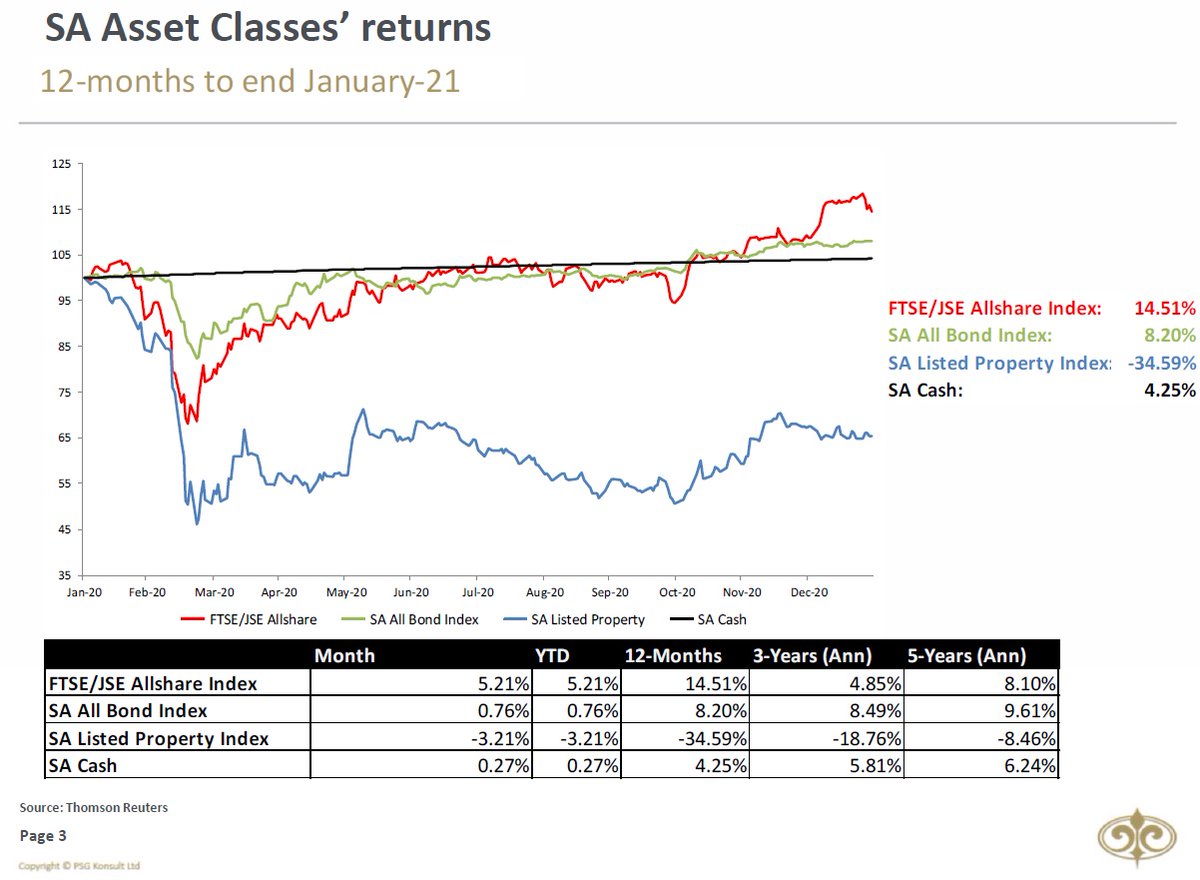
UPDATE ON MARKETS: What an eventful start to 2021. Between short-squeezes and hedge funds blowing up, volatility was definitely on the forefront during January. FTSE/JSE All Share (JSE) improved by 5.21% during January, bringing the 12-month returns to 14.51%. 2/12

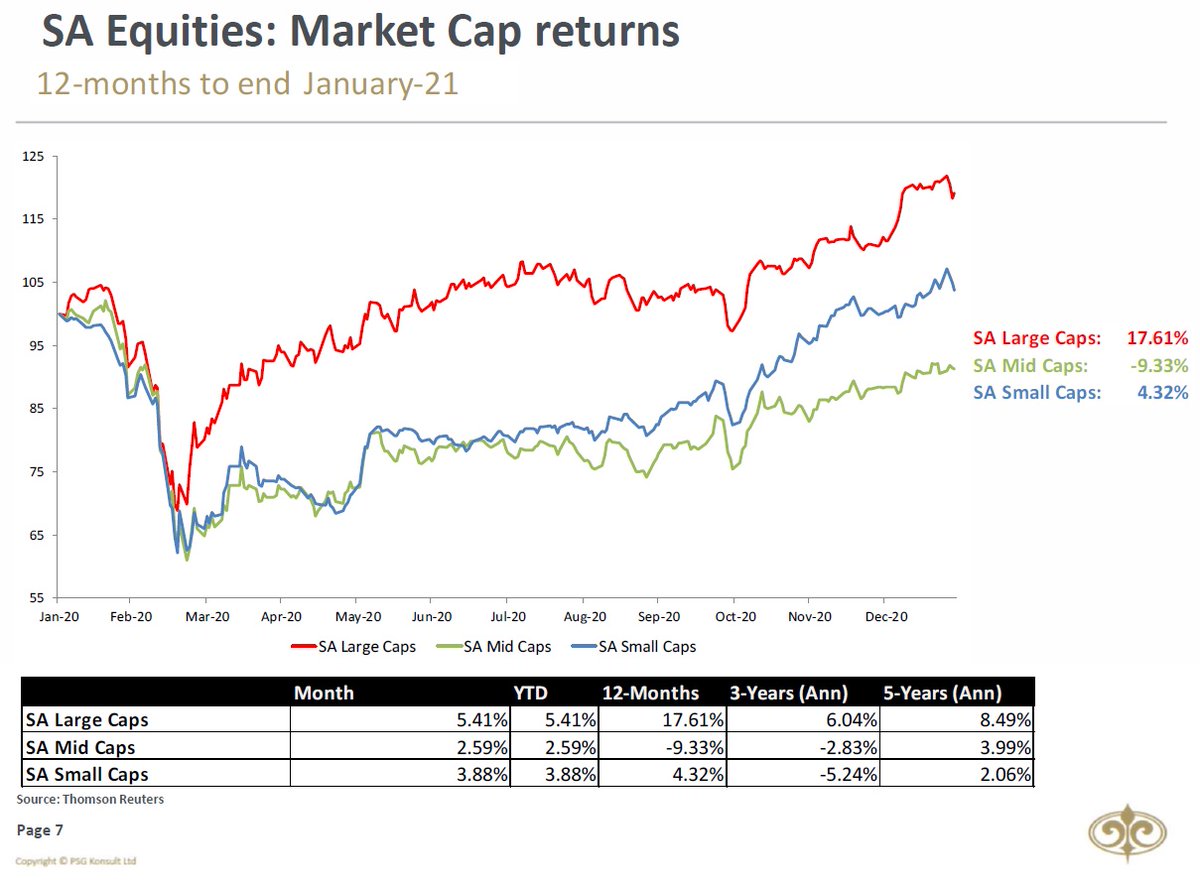
South African Large Caps dominated during January, growing by 5.41%. Mid Caps and Small Caps grew by 2.59% and 3.88%, respectively.
Jan 30, 2021 13 tweets 17 min read
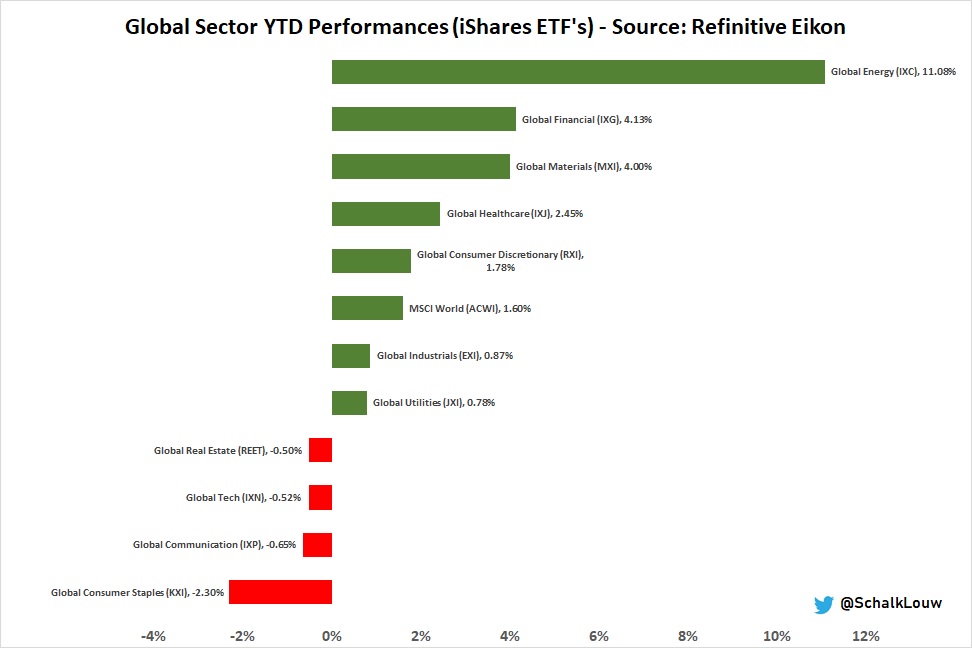
#Global #ETF Weekly & Month-end (thread): 29 Jan 2021

- 2020 worst perf #sector making comeback in 2021 $IXC

- This is helping #oil producing countries with #Nigeria & #UAE in top5 #Country ETF YTD performers in USD $NGE $UAE

- #SouthAfrica $EZA moved into top15 YTD performers 2/12

#EmergingMarkets #ETF still storming ahead against #DevelopedMarkets ETF, still not relatively "overbought" yet, but getting close.

#SouthAfrica might need a lot of catch up, but $EZA YTD performance in USD (+0.2%) continued 2nd half on 2020 recovery against $URTH (-0.8%)
Jan 16, 2021 9 tweets 12 min read
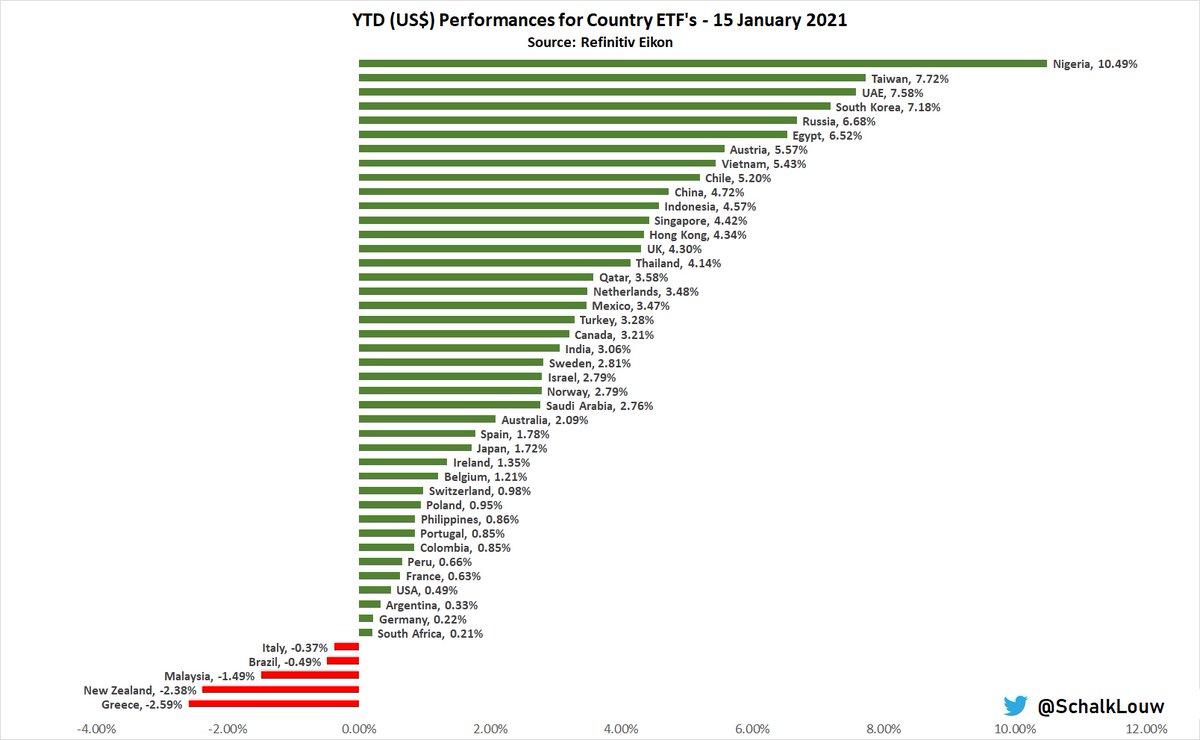
#Global #ETF Weekly (thread): 15 Jan 2021

- 2020 worst perf #sector making comeback in 2021 $IXC

- This is helping #oil producing countries with #Nigeria, #UAE & #Russia in top5 #Country ETF YTD performers in USD $NGE $UAE $ERUS

- Few countries moving in red this week 2/8

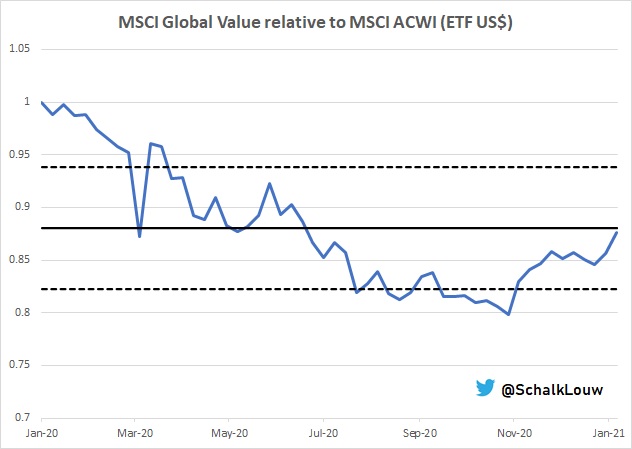
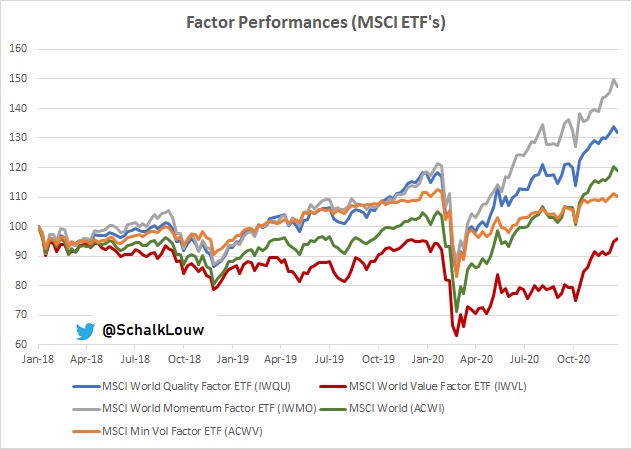
#Global #Value #stocks still making short-term recovery, with $IWVL #ETF still looking very strong relatively over the short-term. Over 3yr period it is however still lagging quite substantially.

This should be interesting for this months #OrbisvsSP500 unofficial challenge
Dec 1, 2020 14 tweets 7 min read
UPDATE ON MARKETS: What a month! FTSE/JSE All Share improved by 10.5% during November, following 4.7% contraction during Oct & 1.6% decline in Sep. SA Property stocks made 17.5% recovery during Nov, bringing YTD performance to -43.6%. SA All Bond Index increased by 3.3% for month 2/13

South African Small Caps continued to perform well during November, growing by 15.56%. Mid-Caps and Large Caps grew by 10.05% and 10.37% respectively.
Nov 1, 2020 13 tweets 8 min read
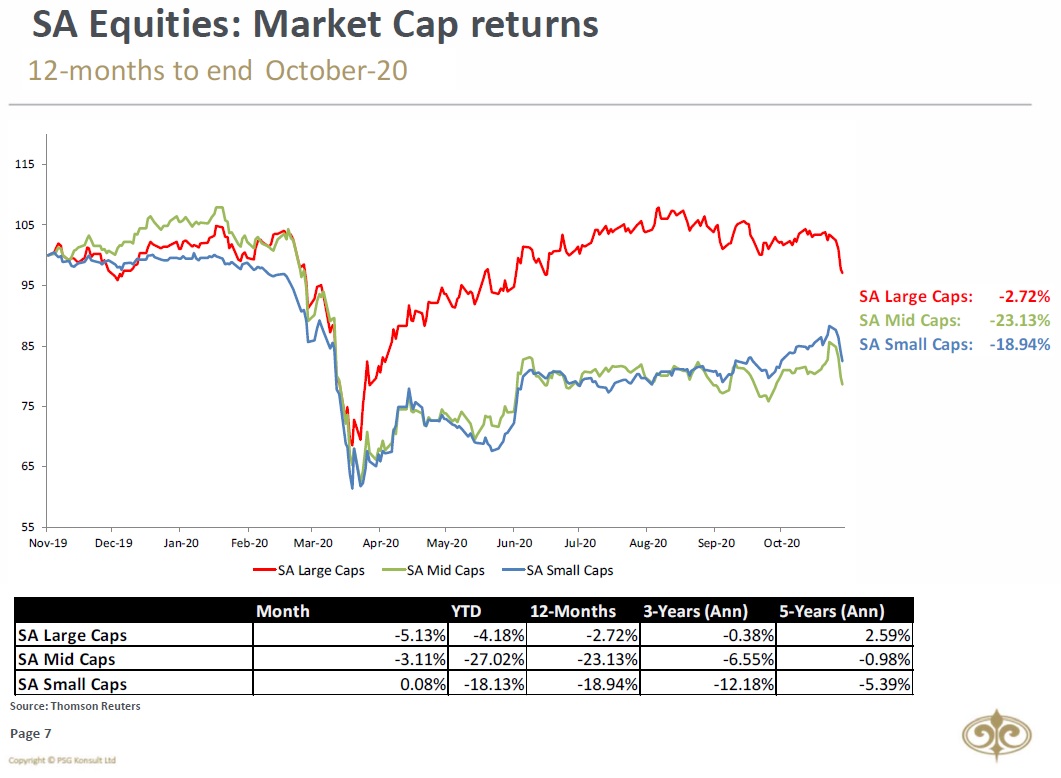
UPDATE ON MARKETS: With flareup of #COVID19 globally & many countries moving back into hard lockdown, #markets reacted. FTSE/JSE All Share contracted by further 4.7% during October, following 1.6% September decline. Another horrible month for Local Property stocks dropping 8.5%. 2/12

South African Small Caps were top performers for October, growing by 0.1% during the month. Mid Caps declined by 3.1% for the period, while Large Caps had a massive loss of 5.1% during October.
Jul 1, 2020 11 tweets 4 min read
UPDATE ON MARKETS: Following the recovery in May, the FTSE/JSE All Share enjoyed another SOLID (+7.74%) month in June. Local Property stocks (SAPY) enjoyed a BIG comeback, increasing by 13.4% during June. Image 2/10

After lagging behind in both April and May, Small Caps was the star performer with an 11.4% increase. Large-Caps again outperformed the JSE (+7.85%), while Mid-Caps lagged somewhat behind with +6.6% over the same period. Image
Jan 1, 2020 11 tweets 5 min read
UPDATE ON MARKETS: Much better month for SA market indeed. FTSE/JSE All Share ended month 3.3% positive in Rand-terms. This brings the full 2019-year return in Rand to 12.1%. SA Property bucked local equity market’s trend, losing 2.1%. Local Bonds improved 1.9% over same period. Page 2/10

Mid-Caps was again the star performer in December, increasing by 4.7%. Large Caps also outperformed the JSE with a monthly return of 3.7%, while Small-Caps only improved by 0.2% over the same period.
Dec 1, 2019 10 tweets 4 min read
UPDATE ON MARKETS: Interesting month indeed. Although JSE ended November down 1.8% in ZAR, this was mainly due to Rand strength, while it actually improved 1.3% in USD. This brings YTD returns in ZAR to 8.5% & 12mth returns to 13.1%. SA Property increased 0.8%. Local Bonds flat. Page2/10

Mid-Caps was again the star performer in November, increasing by 0.6%. Large Caps decreased more than the JSE with -2%, while Small-Caps lost 1.2% over the same period.