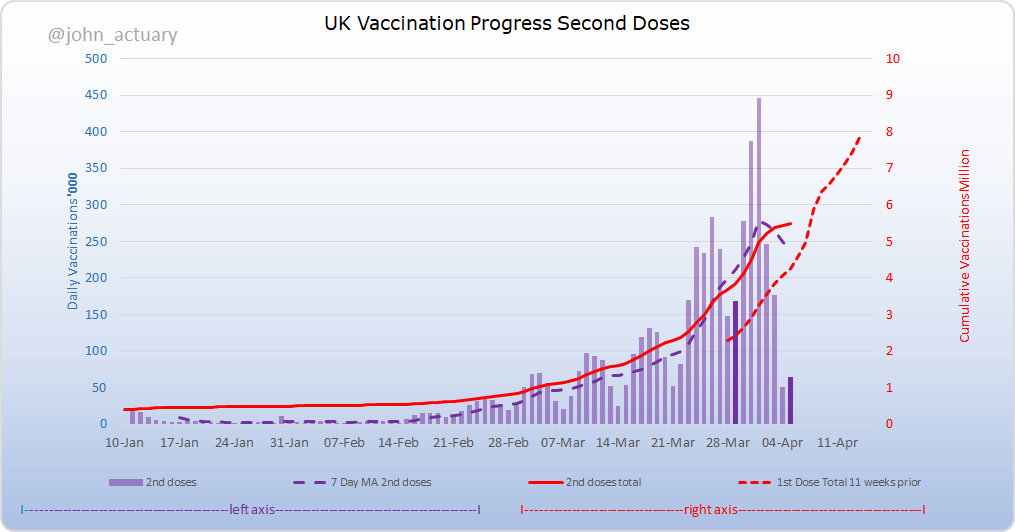
The latest SPI-M modelling by Imperial and Warwick has been published. Both suggest that the current roadmap would result in a third wave of some degree over the summer. The Warwick central scenario is more pessimistic with around 250 deaths pd in Aug.
assets.publishing.service.gov.uk/government/upl…
1/4 Image
One interesting chart by Warwick models who might become ill by vaccine status and age. Of note, during the peak, a high proportion is for those who will have had both doses. The assumption of 90% efficacy against death after 2D drives this figure, but that feels low to me.

2/4 Image
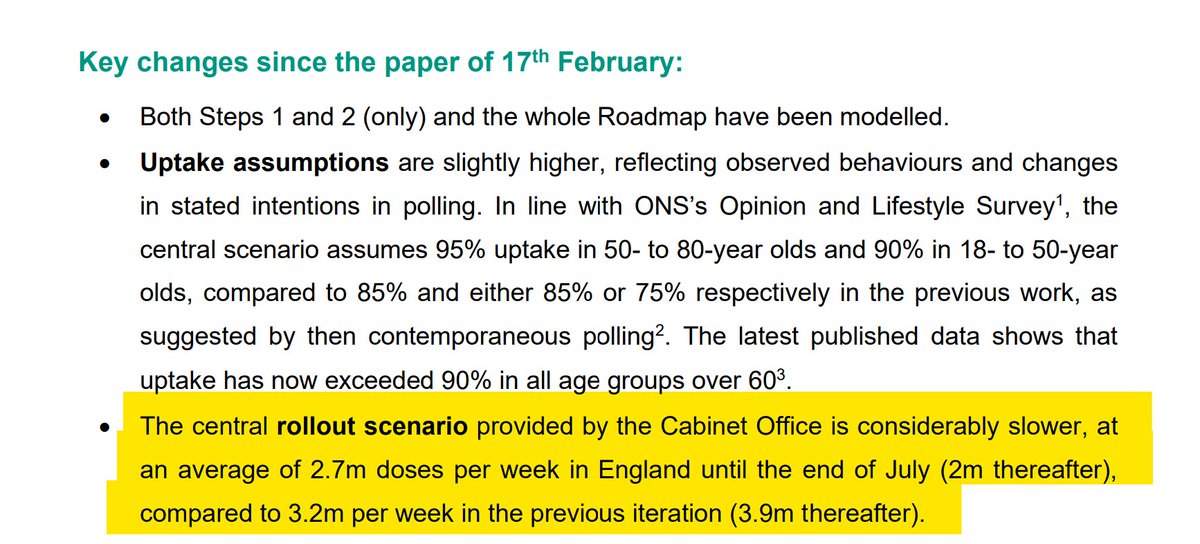
Note that vaccine roll-out in England is assumed at 2.7m pw until end of July and 2m thereafter, which suggests the 4m (UK) we saw in March is unlikely to be repeated. This is a substantial reduction from the previous assumption, suggesting a slower roll-out is now expected.
3/4 Image
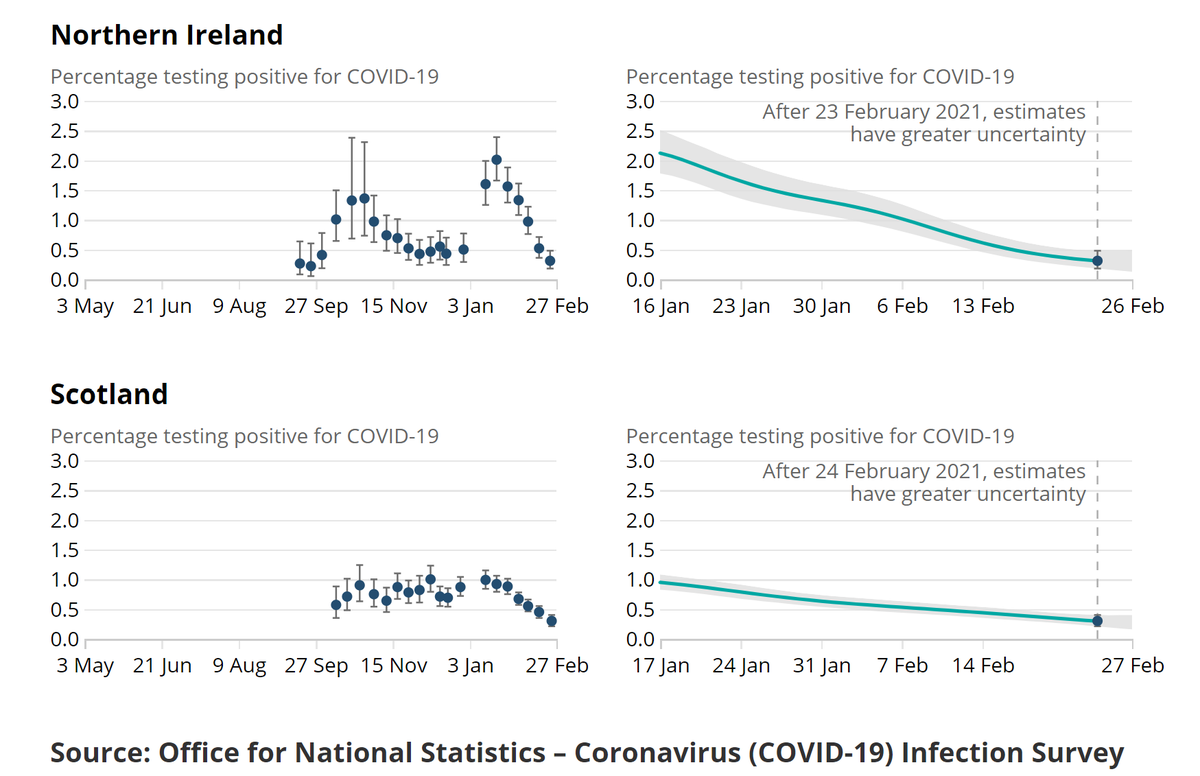
The paper notes the considerable uncertainty, (even in the short term following the 29th March changes, as shown here), and thus there are many sensitivities discussed in detail. So the central assumptions should not be regarded as predictions, tempting as that might be.

4/4 Image

• • •

Missing some Tweet in this thread? You can try to force a refresh
 

Keep Current with John Roberts

John Roberts Profile picture

Stay in touch and get notified when new unrolls are available from this author!

Read all threads

This Thread may be Removed Anytime!

PDF

Twitter may remove this content at anytime! Save it as PDF for later use!

Try unrolling a thread yourself!

how to unroll video
  1. Follow @ThreadReaderApp to mention us!

  2. From a Twitter thread mention us with a keyword "unroll"
@threadreaderapp unroll

Practice here first or read more on our help page!

More from @john_actuary

7 Apr
Wed vaccine update:

For the first working day post Easter, a disappointing 266k total doses, only just over half last week's figure, so the 7 day total drops further to just 2.35m, with 2nd doses making up 2/3rds of that figure.

2nd doses and Wales next.

1/4 ImageImage
With only 180k second doses, down a third on last week, the 7D total continues to fall back, now 1.55m.

The two red lines move ever closer, with only 2 days leeway now over the 11 week benchmark with first dose progress.

A national comparison is of interest though...

2/4 Image
HT to @RhonddaBryant for prompting this, but if we compare current 2nd dose totals to the equivalent nearest 1st dose day we see that:-
E is slowest, only on 20th Jan (76 days)
S/NI are both on 26th Jan (70 days)
W is well ahead on 2nd Feb (63 days).

More on Wales next.

3/4
Read 4 tweets
6 Apr
Tue vaccine update: (Spoiler alert - still v slow)

Only 105k total doses today, down 3/4 from last week, and similar falls to those reported yesterday. Hopefully this is the last day of the Easter effect, although we will probably continue to see low 1st dose numbers.

1/4 ImageImage
It's a similar story for 2nd doses, at just 65k, although the fall is not so marked. But there's more urgency here to recover lost ground, to keep a comfortable margin ahead of the 12 week guide (and my prudent 11W benchmark too.)

Next, what's the prospect from now on?

2/4 Image
The SPI-M papers published yesterday show clearly that the govt has reduced its expectation of the roll-out recently, asking the modellers to slow it from 3.2m to 2.7m for England until the end of July. Beyond that there is an even steeper fall, halved from 3.9m to 2m.

3/4 Image
Read 4 tweets
16 Mar
The latest ONS data show further proportionate falls in the oldest age groups since mid-Jan, benchmarking against the under 70s.

Age 80+ deaths are now 45% lower, age 70-79 are 37% lower.

What might that mean in terms of lives saved?

1/4
Overall COVID deaths in the latest week were around a third lower than they would have been without the vaccine. The total saved by this estimate is now over 4,000 lives.

It's only an estimate of course, we shall probably never know the exact number.

2/4
The rapid fall in infections remains the greatest influence in the overall reduction in deaths we've seen. But we can now clearly see the relative additional impact on those vaccinated first in the faster falls of those age groups.

3/4
Read 4 tweets
14 Mar
With volumes now expected to increase considerably, what possible end dates are there for the adult vaccination programme?

Assuming 4m a week 1st doses could be around three days after the lifting of all restrictions (21 June) - nearly a month later if we only average 3m.
1/4 Image
Once 1st doses are complete, there should be a rapid completion of 2nd doses, with no need to stick to the longer interval. So end of August at the latest, but maybe by mid July if we can sustain the higher level.

2/4
I've assumed a slightly lower take-up for Groups 10-12. You could argue that my assumptions are a little high, but then the aim should be to get as many as possible to be vaccinated. And the latest ONS estimate is that only 6% are hesitant across all age groups.

3/4
Read 4 tweets
8 Mar
A detailed survey from @ONS today on vaccine hesitancy. Overall, the latest figures suggest the lowest hesitancy figures yet.

At 6%, it's halved from Jan (11%) which halved from Dec (22%). A very positive trend!

The age distribution shows the younger are more hesitant.

1/9 Image
Women appear slightly more hesitant, especially at younger ages. We explore one possible reason later.

Full report here: ons.gov.uk/peoplepopulati…

2/9 Image
The most concerning feature of take-up is of course the ethnic differential. This survey is consistent with data for those actually taking up the vaccine that confirm the black community in particular is much more hesitant.

3/9 Image
Read 4 tweets
5 Mar
The latest ONS infectivity data suggests continued strong falls in infections across all four countries, with typically reductions of around a third in a week.
Starting with England, which falls from 0.69% to 0.45%, down 35%. That's now 1-220 of the community population.
1/8
Wales falls by 27%, down from 0.48% to 0.35%, or 1-285 of the population.

Scotland is down from 0.45% to 0.30%, a 33% fall, or 1- 335.

Finally N Ireland falls by 40% from 0.52% to 0.31% or 1-325.

2/8
Regionally most areas are falling although the ONS says that there is more uncertainty in the E Midlands, North East and East. The NE is now double the lowest areas.

3/8
Read 8 tweets

Did Thread Reader help you today?

Support us! We are indie developers!


This site is made by just two indie developers on a laptop doing marketing, support and development! Read more about the story.

Become a Premium Member ($3/month or $30/year) and get exclusive features!

Become Premium

Too expensive? Make a small donation by buying us coffee ($5) or help with server cost ($10)

Donate via Paypal Become our Patreon

Thank you for your support!

Follow Us on Twitter!