
Let's learn about Correlation the most important statistical measure that is also a key tool in machine learning.
#MachineLearning #100DaysOfCode #Python
👇🧵
#MachineLearning #100DaysOfCode #Python
👇🧵
Correlation, as the name suggests, gives the measure of the relationship between two variables.
In statistical terms, it is the measure using which statisticians figure out how much two things are related.
Two things could be related in different extend and ways. For eg:
In statistical terms, it is the measure using which statisticians figure out how much two things are related.
Two things could be related in different extend and ways. For eg:
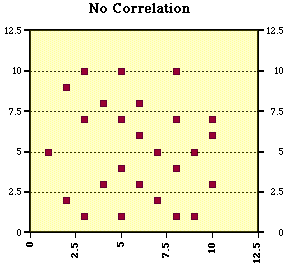
1) If one variable increases, the other variable might increase(+ve correlation), decreases(-ve correlation) or remain unchanged/have no defined pattern( uncorrelated ).
2) Also, this behavior could remain the same for all the values(monotonic) or can vary with the values.
2) Also, this behavior could remain the same for all the values(monotonic) or can vary with the values.


3) It might possible that variables are non-linearly related like a polynomial or even like some other complex function.
It is possible that nonlinear correlation is monotonic (Don't get confused between monotonic and no linearity)
Let's find out how to calculate it now:
It is possible that nonlinear correlation is monotonic (Don't get confused between monotonic and no linearity)
Let's find out how to calculate it now:

To measure correlation, the most widely used is the Pearson Correlation Coefficient which is the covariance of two variables divided by the product of standard deviations.
Thus it ranges from -1 to 1 and gives us both sign and value.
Correlation coeff: en.wikipedia.org/wiki/Pearson_c…
Thus it ranges from -1 to 1 and gives us both sign and value.
Correlation coeff: en.wikipedia.org/wiki/Pearson_c…

Remember the above method is only useful for linear correlation i.e. when both variables vary linearly( positively or negatively)
Also, values above 0.7 to 1 means highly positive correlation ( -0.7 to -1 for negative correlation ) and values between -0.3 to 0.3 for neutral.
Also, values above 0.7 to 1 means highly positive correlation ( -0.7 to -1 for negative correlation ) and values between -0.3 to 0.3 for neutral.
One thing to remember here is we are finding correlation using just a sample of data. That means it doesn't turn out to be perfect.
Also even if variables are correlated, one doesn't necessarily cause a change in other variables(for eg a third variable might be involved too).
Also even if variables are correlated, one doesn't necessarily cause a change in other variables(for eg a third variable might be involved too).
To test whether the correlation makes sense we can do some testing. The most common is Student's t-testing (it's funny why it is called student check out the link)
What we are trying to achieve here is to find whether this correlation can be used for a complete population.
What we are trying to achieve here is to find whether this correlation can be used for a complete population.
We carry out the test which basically gives us a final value called p-value(avoiding calculation of t-value and p-value but you can check out wiki) using which we can decide whether we can accept our hypothesis or not.
t-test: en.wikipedia.org/wiki/Student%2…
t-test: en.wikipedia.org/wiki/Student%2…
Generally, if the value of p is lesser than 0.05 then we reject the hypothesis that our calculation is wrong and we accept that variables are correlated.
And if it is greater then we might need to consider that and it might possible variables are not linearly correlated.
And if it is greater then we might need to consider that and it might possible variables are not linearly correlated.
Btw if two variables are linearly correlated it sounds like linear regression but using correlation we are not going to predict anything.
That is through linear regression which is widely used in ML too.
Correlation is just to measure whether variables are related or not.
That is through linear regression which is widely used in ML too.
Correlation is just to measure whether variables are related or not.
In python, we can directly use a library such as Scipy to get the p-value and correlation coefficient between two variables easily.
Function: scipy.stats.pearsonr()
Two perfectly correlated variables will have a correlation factor of 1 and a p-value of 0.
Function: scipy.stats.pearsonr()
Two perfectly correlated variables will have a correlation factor of 1 and a p-value of 0.

Nice article by @TDataScience : towardsdatascience.com/eveything-you-…
About causation and correlation by @khanacademy:
bit.ly/3cUieQe
Mathisfun tutorial:
mathsisfun.com/data/correlati…
About causation and correlation by @khanacademy:
bit.ly/3cUieQe
Mathisfun tutorial:
mathsisfun.com/data/correlati…
• • •
Missing some Tweet in this thread? You can try to
force a refresh


