Thought of the day: Every member of the Harvard community should be ashamed by the fact that we openly practice affirmative action for rich white people in college admissions.
(Thread based on Arcidiacono, Kinsler & Ransom's forthcoming JOLE paper)
🧵
public.econ.duke.edu/~psarcidi/lega…
(Thread based on Arcidiacono, Kinsler & Ransom's forthcoming JOLE paper)
🧵
public.econ.duke.edu/~psarcidi/lega…
https://twitter.com/annastansbury/status/1379916780982792194
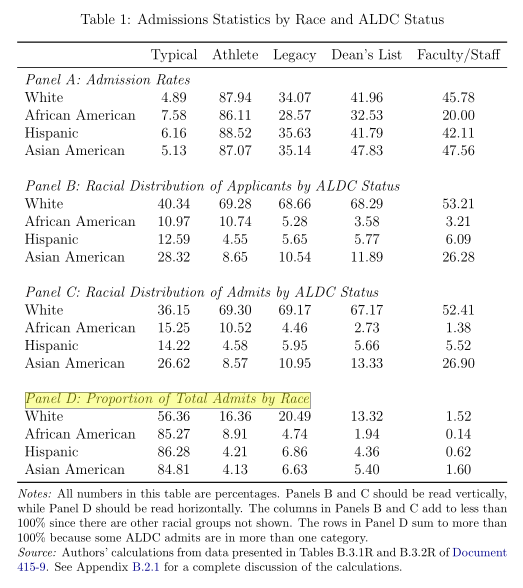
(1) 14% of the admitted Harvard class are legacies. That's 1 in 7! For a typical white applicant (legacies are 70% white), the chance of admission is *FIVE TIMES* higher if you are a legacy. 41% of legacies in the class of 2019 came from top 1% income households.
(Oh, and there is literally a "Lineage" field on the application, apparently. Welcome to the US's hereditary aristocracy.) 

(2) 10% of the admitted Harvard class are recruited athletes. (16% of white admits).
The admissions rate of recruited athletes is 86%, compared to less than 5.5% for typical admits (& this underestimates the admission advantage b/c doesn't control for other characteristics).
The admissions rate of recruited athletes is 86%, compared to less than 5.5% for typical admits (& this underestimates the admission advantage b/c doesn't control for other characteristics).
Why are athletes an issue for equity? Recruited athletes at Harvard skew rich and white. 70% are white. Most of these are well off: 3% of white athletes are economically disadvantaged compared to 15% of white admits. 26% of white athletes come from top 1% income households.
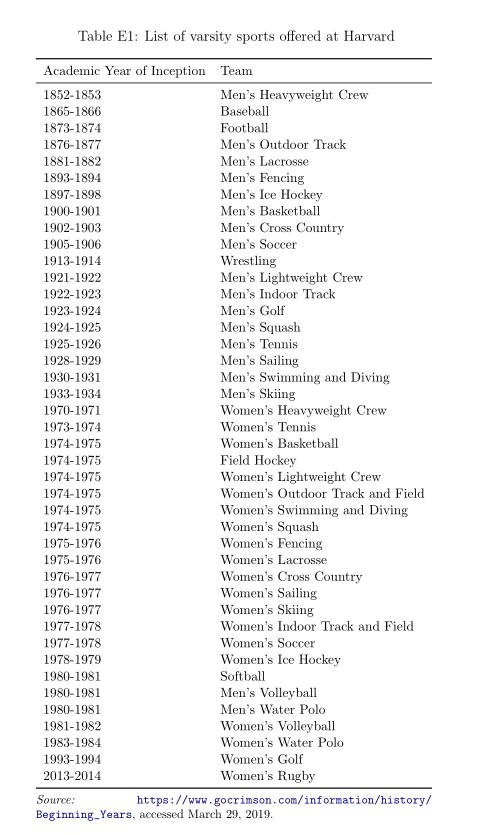
FWIW, skewing rich & white isn't necessarily intrinsic to having recruited athletics! (though that is a whole separate conversation). It appears to be partly because of the varsity sports Harvard offers: often expensive, often elite, including fencing, sailing, and skiing. 


(3) The Dean's List. I'm unclear exactly what this is, but seems to include relatives of donors or "potential donors". 14% of white admits are on the Dean's list (compared to 2%, 4%, and 5% for African-American, Hispanic, and Asian-American admits respectively). 

Dean's list applicants seem to get a big admissions advantage. Based on raw numbers, about 30-50% of applicants on the Dean's list get admission. From AKR's estimates, a dean's list applicant is 7x more likely to be admitted than an otherwise comparable non-dean's list applicant.
(4) Then there is the children of faculty and staff. They only make up a small share of the class (less than 2% of white & Asian American admits, less than 1% of Hispanic & African American admits). But this pool also skews white and privileged & receives preferential admission.
*The most mind-blowing stat*:
In total, 43% of white admits to Harvard college are athletes, legacies, dean's list, or the children of faculty or staff.
Only about 15% of African-American, Hispanic, or Asian-American admits fit into these categories (See Panel D).
In total, 43% of white admits to Harvard college are athletes, legacies, dean's list, or the children of faculty or staff.
Only about 15% of African-American, Hispanic, or Asian-American admits fit into these categories (See Panel D).

What would happen to the Harvard admit pool if legacy, athlete, dean's list, and faculty/staff children preferences were removed?
Based on all the above, almost certainly Harvard college would become more diverse both by race & income background.
Based on all the above, almost certainly Harvard college would become more diverse both by race & income background.
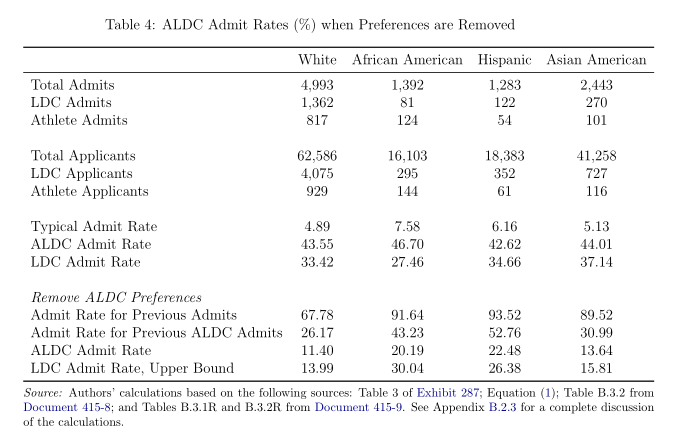
Indeed, AKR use their preferred model to estimate that if these preferences were removed, the admitted student pool would see fewer white admits, more Hispanic and Asian American admits, and the same number of African-American admits. 

I hope more of us affiliated with Harvard will be having the important conversations about how we can reduce the school's role in perpetuating elite privilege like this. And the other schools who practice these kinds of policies too, while we're at it.
/End
/End
PS. Needless to say, I hope: I have loved and appreciated the many, many students I've taught at Harvard. Statistically, I'm sure many fell into these categories. My comments here have no bearing on my opinions of each of my wonderful former students. ...
... This is a systemic question, not a personal one, and the more of us can recognize the fact that our privilege played a big role in getting us where we are, the faster we can start using that privilege to make things better for those who come next.
Some additions based on discussion in comments:
1/ To be clear I'm against legacy, donor etc preferences REGARDLESS of the racial makeup because they unfairly privilege the privileged. But the *effect* is also racially disparate and I think that's important to highlight.
1/ To be clear I'm against legacy, donor etc preferences REGARDLESS of the racial makeup because they unfairly privilege the privileged. But the *effect* is also racially disparate and I think that's important to highlight.
2/ These preferences privilege kids from rich backgrounds, who are disproportionately white. The losers are kids from non-rich backgrounds, which includes kids from all races, including non-rich white kids.
3/ Afaict it's unclear from the paper whether the racially disparate effect of these privileges *also* occurs conditional on household wealth & prior connections, or whether it is all mediated through those factors. (Which of course are disparate by race).
4/ Understanding the counterfactual without legacy, deans list, athlete preferences is tricky because it requires assumptions about how behavior responds in other areas. For example, if you assume Harvard sets race quotas for intake, getting rid of legacy prefs ...
... would substantially increase socioeconomic diversity but would not change racial diversity. If you assume Harvard has implicit HH wealth quotas, getting rid of legacy could simply lead to selection on wealth by other means. Etc.
• • •
Missing some Tweet in this thread? You can try to
force a refresh


