Latest update from REACT-1.

Looks 11-30 March (schools fully reopened on 8th March).

- Suggests infection rates fell by around 60% between Feb and March to 0.2%
- Big differences by age, region, and deprivation
- R now estimated at approx 1.

imperial.ac.uk/news/218993/co…
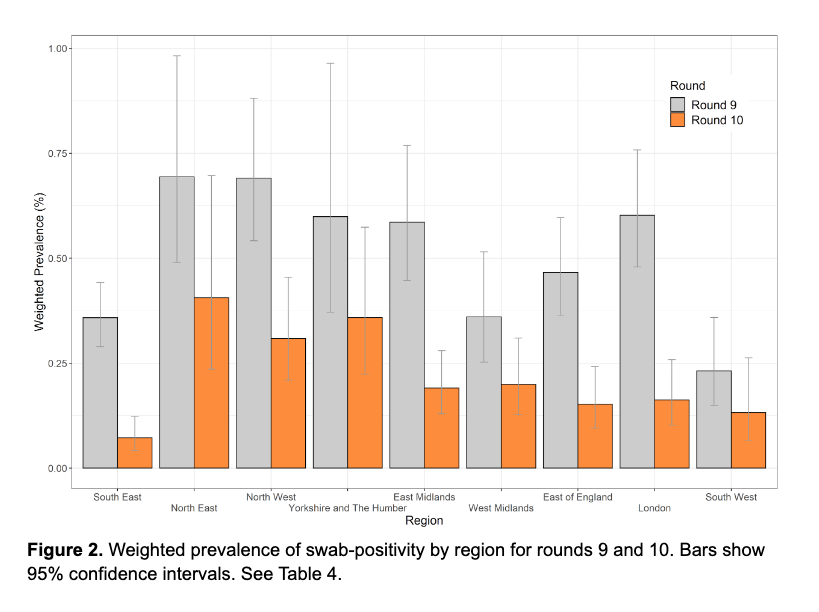
Falls across all regions but highest rates still in NE, NW, and Yorkshire and Humber (round 9 is swabs from 4th-23rd Feb, round 10 is 11th-30th March)

Includes 12% probability R>1 for Y&H between two rounds. <1% in all other regions.

This is consistent with ONS survey data.
Highest infection rates among 5-12y/o (as does ONS), but REACT suggests lower infection rates among school age children than ONS does.
And finally, over twice as likely to be infected if live in most vs least deprived parts of the country (see bottom of table)

• • •

Missing some Tweet in this thread? You can try to force a refresh
 

Keep Current with Adam Briggs

Adam Briggs Profile picture

Stay in touch and get notified when new unrolls are available from this author!

Read all threads

This Thread may be Removed Anytime!

PDF

Twitter may remove this content at anytime! Save it as PDF for later use!

Try unrolling a thread yourself!

how to unroll video
  1. Follow @ThreadReaderApp to mention us!

  2. From a Twitter thread mention us with a keyword "unroll"
@threadreaderapp unroll

Practice here first or read more on our help page!

More from @ADMBriggs

8 Apr
This week's Test & Trace data - for 25th to 31st March (around the last week of school before holidays)

🧵
tl,dr:
- LFD tests down
- big variations in LFD use across the country
- and increase contacts per case.

gov.uk/government/pub… ImageImageImage
The number of people tested week on week has fallen for the past two weeks, down to 4.8m from a high of 6.2m. Image
The fall is due to reductions in LFD use - down 23% to 5.5m. Image
Read 25 tweets
8 Apr
This week's @PHE_uk COVID surveillance report, 29th March to 4th April (incl. start of the school hols). 🧵

⬇️ case rates, partly from fewer 10-19y/o LFDs with no clear sign yet of schools leading to ⬆️cases in older ages

+ important variation by region

gov.uk/government/sta…
Further drop in cases in the most recent week following a bit of a flattening off in previous weeks - with some of this due to school holidays and fewer LFD tests.

Worth noting that for March, both REACT and ONS surveys suggest that case rates are generally static. ImageImageImage
Big drop in LFD use, which is mainly due to a drop in test use by secondary schools (see T&T data).

The drop off has accelerated with the school holidays, but the move from testing in school to at home may have contributed over the past few weeks. ImageImage
Read 19 tweets
1 Apr
PHE latest COVID surveillance report now out, as is ONS.

Covers 22nd-28th March 🧵

tl,dr:
-cases down all ages except 10-19yrs.
-Significant geographical variation.
-Vax still motoring.
Fall in case rates in all age gps (incl 5-9y/o) *except* for 10-19y/o where they've increased by 7% to 110 cases/100,000.

Lowest cases rates are among 70-79y/o at just 11/100,000, and generally there's a step decrease in case rates for ages 60yrs+ compared to those <60yrs.
And among 10-19y/o, case rates seem to be rising mainly among 10-16y/os.
Read 27 tweets
27 Mar
If this is true, it is so disappointingly shortsighted.

I hope that @MattHancock and @Jochurchill4 will reconsider.

A quick walk through the evidence. 🧵
Nearly one in four reception age children and one in three children at year 6 are overweight or obese.

And there are stark inequalities - children in yr 6 are *more than twice* as likely to be obese if living in the most deprived areas compared to the least.
The government is aiming to halve childhood obesity by 2030 and reduce inequalities.

You can't do this with one or two policies here and there. Obesity is complex and multifaceted. To make any kind of dent, you need a multifaceted solution.

health.org.uk/publications/l…
Read 19 tweets
25 Mar
And most recent T&T data, 11/3 to 17/3. 🧵

- More testing
- Fewer cases
- And the numbers of non-household close contacts is rising again.

This week, just a short thread to pull out main points.

gov.uk/government/pub… Image
Small increase in number of people tested but rise of 1.3m in number of LFDs used, driven by secondary schools. ImageImageImage
And case rates generally still falling, except among school age children

Read 10 tweets
25 Mar
This week's PHE surveillance report is now out, covering 15-21 March. 🧵

Tl,dr:
- increasing case rates among 5-9y/o and 10-19y/o
- important geographic variation
- hospital data still improving
- vax going strong
- and inequalities persist.

gov.uk/government/sta…
Number of PCR and LFD tests done similar to the previous week, but positivity (percentage of tests that are positive) for PCR still trending down and is now 2.1%

For LFDs it's 0.19% compared with 0.15% the week before.
Case rates are falling less slowly, but they're still falling across all ages...

*except* 5-9y/o where they're up 59% to 63.5/100,000, and 10-19y/o where they're up 26% to 100.7/100,000.

Case rates lowest in vaccinated cohorts.
Read 23 tweets

Did Thread Reader help you today?

Support us! We are indie developers!


This site is made by just two indie developers on a laptop doing marketing, support and development! Read more about the story.

Become a Premium Member ($3/month or $30/year) and get exclusive features!

Become Premium

Too expensive? Make a small donation by buying us coffee ($5) or help with server cost ($10)

Donate via Paypal Become our Patreon

Thank you for your support!

Follow Us on Twitter!