This week's Test & Trace data - for 25th to 31st March (around the last week of school before holidays)
🧵
tl,dr:
- LFD tests down
- big variations in LFD use across the country
- and increase contacts per case.
gov.uk/government/pub…
🧵
tl,dr:
- LFD tests down
- big variations in LFD use across the country
- and increase contacts per case.
gov.uk/government/pub…


The number of people tested week on week has fallen for the past two weeks, down to 4.8m from a high of 6.2m.

The fall is due to reductions in LFD use - down 23% to 5.5m.

And this is driven by drops in testing in secondary schools - down 33% on the past week.
Partly this will be from an overlap with school hols, but it also may relate to the shift to testing at home rather than the first week being in school.
Partly this will be from an overlap with school hols, but it also may relate to the shift to testing at home rather than the first week being in school.


In terms of what this means for case numbers, some of that's picked up here:
https://twitter.com/ADMBriggs/status/1380190552109543428?s=20
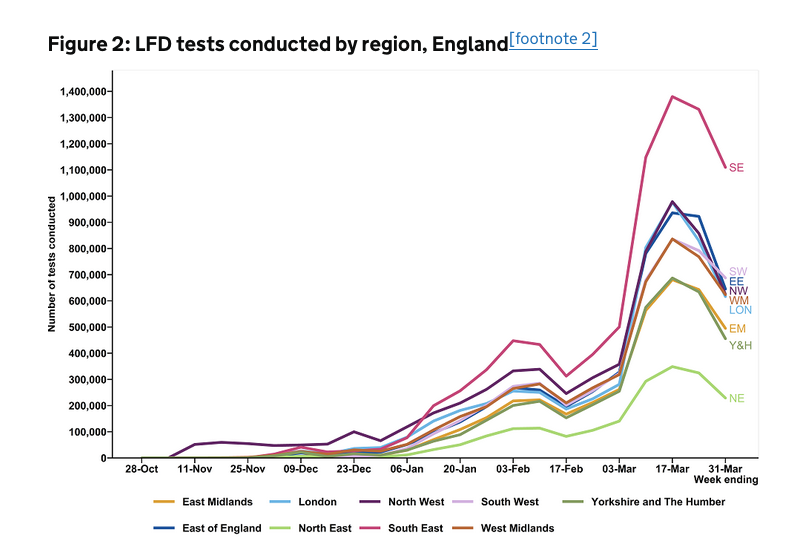
There are significant differences in LFD use by region. T&T publish absolute values, but when looking at rates per 100,000, the biggest difference is between London and the SW.
LFD use in SW was 12,224 tests per 100,000, nearly double that in London at 6,877 per 100,000.
LFD use in SW was 12,224 tests per 100,000, nearly double that in London at 6,877 per 100,000.

The differences by upper tier local authority are greater, varying over 5-fold from 3,045 LFDs used per 100,000 in Tower Hamlets, to 16,026 per 100,000 in N Somerset.
Some of this will be due to differences in the proportion of people eligible for the various government testing schemes, but it may also reflect differences in knowledge of test availability, willingness to get tested (for a range of reasons), or test access and availability.
Barriers to test uptake relate to barriers to isolation adherence.
And whilst more info for these differences between regions would be helpful, it's likely that the same barriers that have been studied for PCR testing will relate to LFD use.
bmj.com/content/372/bm…
And whilst more info for these differences between regions would be helpful, it's likely that the same barriers that have been studied for PCR testing will relate to LFD use.
bmj.com/content/372/bm…
Finally, differences in uptake rates may be a result of - and exacerbate - inequalities.
Easy test access, clear & consistent comms (that is language appropriate), & adequate support if testing positive are all v likely to help.
Ideally all co-designed with those most affected.
Easy test access, clear & consistent comms (that is language appropriate), & adequate support if testing positive are all v likely to help.
Ideally all co-designed with those most affected.
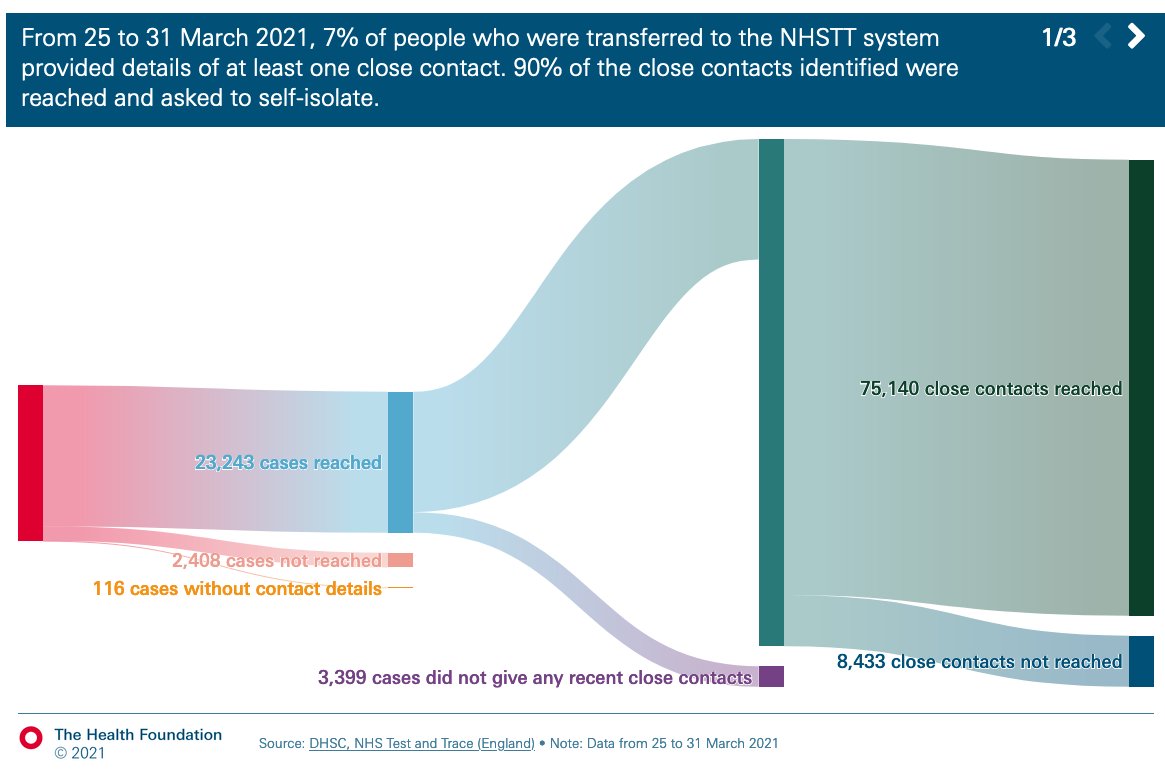
In terms of contact tracing, 25,767 cases were transferred to T&T and 23,243 (90%) were reached.
Of these, 19,844 (85%) gave details of close contacts.
All similar to the week before.
Of these, 19,844 (85%) gave details of close contacts.
All similar to the week before.


These 19,844 cases identified 85,573 contacts - or 3.6 contacts per case overall.
Almost all cases and contacts are now handled by T&T and local authority contact tracing teams.
Almost all cases and contacts are now handled by T&T and local authority contact tracing teams.

This is because many cases that were previously classed as complex or high risk are now more manageable, - the organisations are better equipped at handling cases, guidance is always improving, T&T/local contact tracing teams have improving processes.
And this also gives more space for PHE Health Protection Teams to concentrate on handling variants of concern.
The avg number of contacts/case has been rising wk on wk from a low of 2.0 since mid Feb.
And while the proportion of people giving details of contacts and the proportion of contacts that are from the same HH hasn't changed since last week, it does point to more social mixing.
And while the proportion of people giving details of contacts and the proportion of contacts that are from the same HH hasn't changed since last week, it does point to more social mixing.

As lock down eases further, we should expect the number close contacts identified to rise further still.
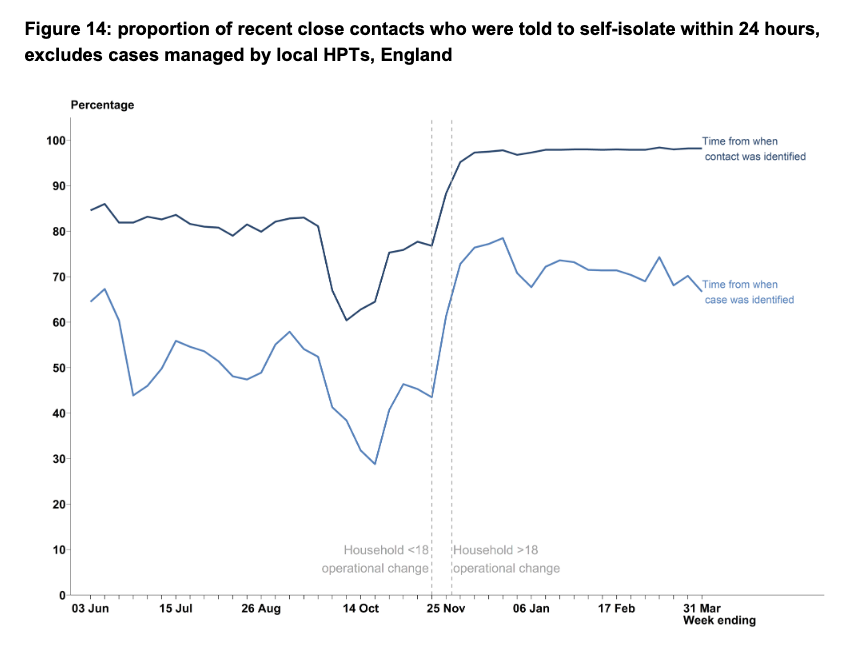
The percentage of contacts reached has remained steady at 90%

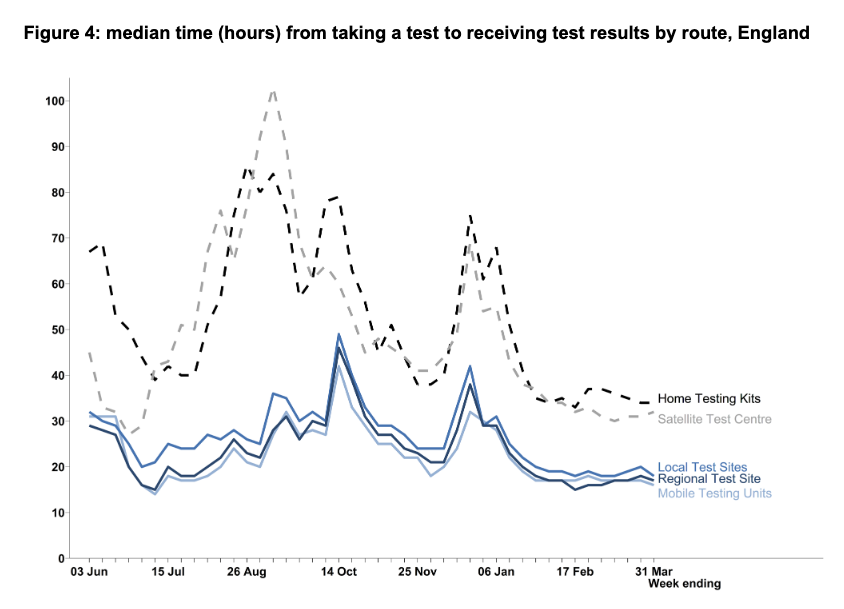
And the total end-to-end journey time is also relatively static and has been for some time.
There are efforts with local authority contact tracing systems to speed this up (taking all or certain cases from the national team earlier etc) so will be interesting to see if it helps.
There are efforts with local authority contact tracing systems to speed this up (taking all or certain cases from the national team earlier etc) so will be interesting to see if it helps.


Finally, as hinted at earlier in the thread, none of these data tell us anything about people not getting tested or unable to adhere to isolation.
We know this is important, particularly for tackling ongoing inequalities in case rates and areas with enduring transmission.
We know this is important, particularly for tackling ongoing inequalities in case rates and areas with enduring transmission.
So while reported T&T performance remains relatively good, it's crucial to still study test uptake and isolation adherence, and to continue to develop and push for policies that can support those most in need.
This includes tackling the many structural factors underlying ongoing high case rates across much of the country.
https://twitter.com/ADMBriggs/status/1377656081732804609?s=20
Here's the link to our freshly updated @HealthFdn T&T performance tracker, with @cfraserepi.
Has some great figures, and looks into some of the testing in more detail.
health.org.uk/news-and-comme…
Has some great figures, and looks into some of the testing in more detail.
health.org.uk/news-and-comme…
wk 44 T&T ☝️ @felly500 @trishgreenhalgh @deb_cohen
@martinmckee @carolecadwalla @mgtmccartney
@ADPHUK @Jeanelleuk @fascinatorfun @profchrisham @petermbenglish @HPIAndyCowper @Davewwest @HSJEditor @KateAlvanley
@IndependentSage @nedwards_1
@chrischirp @SamanthaJonesUK
@martinmckee @carolecadwalla @mgtmccartney
@ADPHUK @Jeanelleuk @fascinatorfun @profchrisham @petermbenglish @HPIAndyCowper @Davewwest @HSJEditor @KateAlvanley
@IndependentSage @nedwards_1
@chrischirp @SamanthaJonesUK
@ewanbirney @TimHarford @devisridhar @FurberA
@andrewleedr @kieran_walshe @DrChadborn @Dr_D_Robertson
@andrewleedr @kieran_walshe @DrChadborn @Dr_D_Robertson
And finally for info, barring something of particular interest, I'm going to move to writing these T&T threads, as well as the PHE COVID surveillance threads, every fortnight (or so) rather than weekly.
I do love all these data, but you know, Thursday evenings were once fun.
I do love all these data, but you know, Thursday evenings were once fun.
• • •
Missing some Tweet in this thread? You can try to
force a refresh