1/6 🇸🇪 Update all cause mortality April through March (March included, 2021 provisional)👇🏽red line indicates 20/21 mortality rate compared with previous 30 year period.
In next tweet update of monthly mortality rates including March as well >>
2/6 comp mortality rates per month to average of 2015-2019. Including March 2021 (prel figures as reported by SCB). So far, Feb and March below average mortality. March will be adjusted upwards.
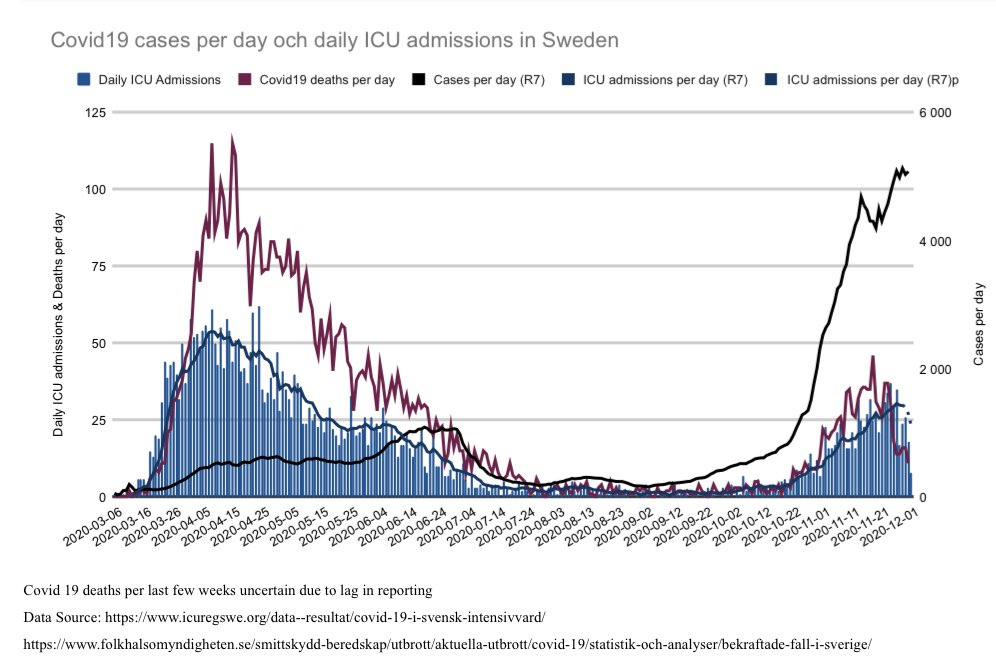
Recently uptick in ICU, how will it compare with April of 2020? we will see >>
3/6 ICU Sweden👇🏽 and a few of my previous charts regarding 2020 final figures. >>
1/5 🇸🇪 if anyone is interested in moving to Swe I’ll present to you a couple of figures from the Swedish temperature record. Also, fun to look at something than covid for a change☺️
This is an incomplete picture of Swe temp but enjoy an average of 8 Degrees >>
1/6 🇸🇪 patients to emergency rooms (somatiska akutmottagningar) declined during 2020. Ca 159k fewer patients (emergency room) during 2020 compared with 2019 (period March-September). Partly as a result of people being afraid but also due to other causes. Blue line is... +
2/6 total patients to emergency room during 2020 and it’s per 100k.
This chart👇🏽 presents data per region as deviation from average of 2017-2019. We see sharp declines most notably i Gothenburg region (Västra Götaland). +
3/6 largest %decreases we have seen in upper respiratory infections and it seems largest absolute decrease would be injuries, abdominal pain.
Only one area with slight increase, violent abuse... +
1/6 🇸🇪 pre weekend update
-ICU admissions
-ICU total
-covid-19 deaths per day ma7
-regions (cases + ICU)
For the moment ICU admissions have reached a plateau with peak lower than during spring +
2/6 also we can see that total ICU beds occupied by covid patients in Sweden have reached a - so far - lower peak/plateau than during spring. As is known, Sweden have a low ICU beds per capita capacity which however can be increased, as was did during spring. +
3/6 what is a however more pressning is personnel where fatigue is increasing as in Stockholm where spring was difficult. Even here however we see that covid - as of now - is less than during spring. +
1/5 🇸🇪 A regional dive into ICU Admissions & cases for
Stockholm, Västra Götaland, Skåne and Uppsala + weekly admissions
Stockholm👇🏽 adding red-line in all graphs which indicate 2 weeks +/-3 days from local advice. You can determine for yourself the possible effect on ICU. +
2/5 Västra Götaland (Gothenburg) seems to have been on a plateau in terms of admissions since around 10 November. +
3/5 Uppsala - positive trend in terms of not higher admission rates. To early to say anything. But whereas spring was typically sharp rise with slow decline we now seems to see a gentler increase and decrease all together but more extended? +
ICU admissions increase slightly between week 47-48 but less than week before and perhaps less since increase began. Still figure has to stabilise.
In next tweets we look at
- cases
- corona dod
- acm
- acm compared between 4 age groups
+
2/4 Cases 🆙
There is no sudden spike rather slow increase of other metrics in graph —> ICU admissions and covid deaths... +
3/4 weekly all cause mortality graph updated inc covid deaths, data released today. We are now above average acm and we have seen covid deaths increase as well.
We have had some 20 weeks with below average, now broken. +