Some great slides from the Crowdstrike investor briefing last week. A few call outs on what makes them such a great business, that others should aspire to:

1. TAM Expansion: The best businesses increase the size of the pie, not just their piece
2. Product Expansion Velocity: At IPO (in 2019) Crowdstrike had 10 modules. They now have 19. Amazing product development velocity
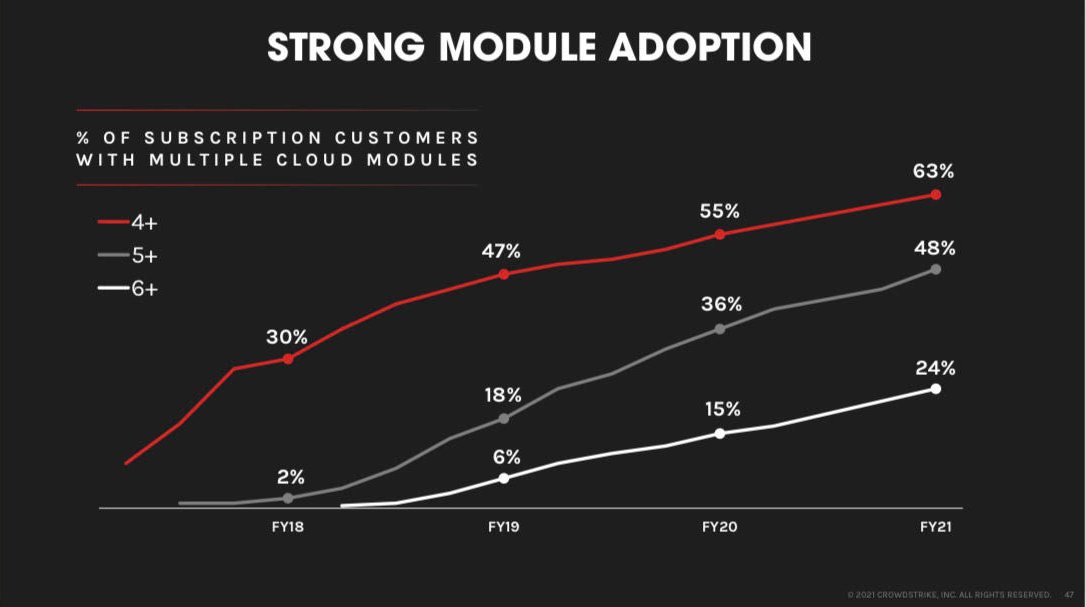
3. Upsell / Cross-Sell: Customers are using more and more Crowdstrike products. Very powerful platform flywheel
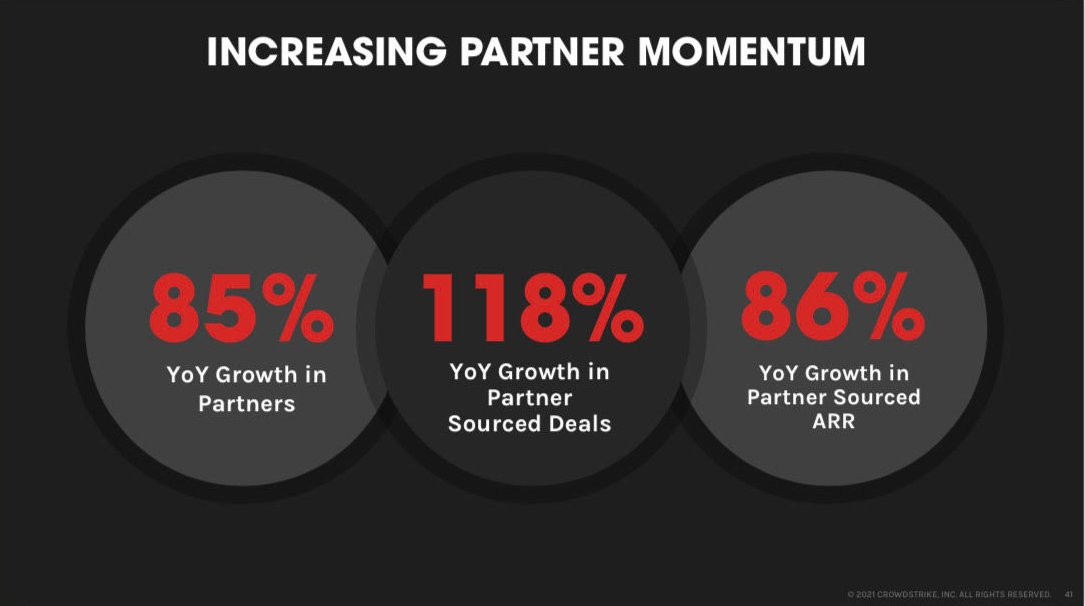
4. Go-To-Market Leverage: Channel / Partner sales showing significant momentum
5. Strong Margin Expansion: Great operating leverage

• • •

Missing some Tweet in this thread? You can try to force a refresh
 

Keep Current with Jamin Ball

Jamin Ball Profile picture

Stay in touch and get notified when new unrolls are available from this author!

Read all threads

This Thread may be Removed Anytime!

PDF

Twitter may remove this content at anytime! Save it as PDF for later use!

Try unrolling a thread yourself!

how to unroll video
  1. Follow @ThreadReaderApp to mention us!

  2. From a Twitter thread mention us with a keyword "unroll"
@threadreaderapp unroll

Practice here first or read more on our help page!

More from @jaminball

10 Mar
I always enjoy reading Bessemer's annual State of the Cloud report. One of my favorite slides below. The takeaway? Leading cloud companies don't decelerate growth nearly as quickly as they're expected to. Why? Cloud markets are almost always much bigger than anticipated
Analysts constantly underestimate leading cloud companies ability to sustain higher growth rates for longer periods of time
I also liked the metric of Growth Endurance they discussed. This is defined as current year growth / last year growth. Nearly 1/3 of cloud companies accelerate growth! (growth endurance > 100%). Data points include every BVP Nasdaq Cloud company over last decade
Read 4 tweets
19 Jan
A trend I'm excited for this year: DataOps & the Analytical Engineer

~10 years ago DevOps was born. The role of system admins and developers merged. Infrastructure became self-serve

Today the role of data engineers and business analysts are merging. Data is becoming self-serve
Data infrastructure is becoming so powerful that the tools today allow non-technical folks to carry out the once complicated / custom code/ huge backlog jobs of data engineers.

Before getting into what this means, let's first discuss how we got here
Before 2012 the data world was dominated by transactional (OLTP) databases like PostgreSQL, MySQL, etc and analytical (OLAP) databases like Oracle, Netezza

Tools like Informatica / Talend were used to batch load (ETL) data into these databases, Tableau used to visualize
Read 25 tweets
10 Dec 20
My biggest takeaway from Q3 cloud earnings? We REALLY saw cloud businesses ACCELEERATE. Since Covid began we heard anecdotal data of "digital transformations accelerating." But the data was never there. It is now. Data below shows the absolute change in rev growth % from Q3 to Q2
For further clarification - the graph shows the delta between Q3 YoY growth rate and Q2 YoY growth rate (I tried to normalize for acquisitions where I could, sure I missed some). As an example - Zoom grew 367% in Q3 and 355% in Q2, so the delta, 12%, is graphed.
I'm defining "accelerating" as YoY rev growth that is increasing on an absolute basis. And as you can see, there are plenty of businesses who accelerated this quarter
Read 14 tweets
1 Oct 20
Great report from Morgan Stanley today on the Identity Access Management market.

They claim an increasingly cloud-based and distributed workforce shifts security control towards Identity & Access Management, driving a considerably larger >$30B TAM vs. industry estimates 👇
IAM is the top CSO priority: Image
Their bottoms up TAM is MUCH LARGER than IDC. They believe the shift to cloud greatly expands the IAM market Image
Read 5 tweets
30 Sep 20
Some cool new Twilio products announced today at their Signal conference. As engagement channels shift from physical to digital Twilio has gotten a boost. 500% growth in Twilio Video usage, and total messages 2x first half of this year. More announcements below $TWLO
1) Twilio Frontline: a mobile application that allows field workers to seamlessly and securely engage directly with customers from their personal devices

2) Twilio Video Web RTC Go: a free toolkit that eliminates the complexity of building on top of WebRTC for video messaging
3) Twilio Flex Ecosystem: since its launch on the SIGNAL stage in 2018 Twilio Flex has added more than 100 new features. The Flex Ecosystem gives organizations access to more than 30 validated partner solutions from partners such as Google, Salesforce, Zendesk, and Calabrio
Read 4 tweets
24 Sep 20
A few weeks ago I shared a graphic looking at the change in YoY growth rates for SaaS businesses from Q2 to Q1. I thought another interesting analysis would be looking at the change in net new ARR added from Q2 to Q1. The data below shows the % change: Image
To calculate net new ARR in a given quarter I first take the quarterly subscription revenue (where disclosed) and multiply it by 4 to get an implied ARR metric. I do the same thing for the quarter prior. The difference between the 2 is the implied net new ARR added in a quarter
What's graphed is the % change in net new ARR added in Q2 vs Q1.

An example: Fastly added $48.3M net new ARR in Q2 and $15.8M of net new ARR in Q1. The number shown is the growth in net new ARR 205%. (shoutout to my Fastly bulls)
Read 15 tweets

Did Thread Reader help you today?

Support us! We are indie developers!


This site is made by just two indie developers on a laptop doing marketing, support and development! Read more about the story.

Become a Premium Member ($3/month or $30/year) and get exclusive features!

Become Premium

Too expensive? Make a small donation by buying us coffee ($5) or help with server cost ($10)

Donate via Paypal Become our Patreon

Thank you for your support!

Follow Us on Twitter!