1/ Constructing Long-Only Multi-Factor Strategies: Portfolio Blending versus Signal Blending (Ghayur, Heaney, Platt)
"For low-to-moderate factor exposures, portfolio blending works better than signal blending due to interaction effects between factors."
papers.ssrn.com/sol3/papers.cf…
"For low-to-moderate factor exposures, portfolio blending works better than signal blending due to interaction effects between factors."
papers.ssrn.com/sol3/papers.cf…

2/ "We describe a basic framework for constructing average exposure-matched portfolios using the signal blending and portfolio blending approaches.
"Securities are overweighting and underweighting based on a percentile threshold (e.g., top 50% based on factor z-scores)."
"Securities are overweighting and underweighting based on a percentile threshold (e.g., top 50% based on factor z-scores)."


3/ For *low* factor exposure portfolios, stocks are included if z-scores are in the top half.
"Given the large overlap and similarities in active weight, we expect the portfolios' performances to be similar. However, the portfolio blend generates a higher IR (0.89 vs. 0.59)."
"Given the large overlap and similarities in active weight, we expect the portfolios' performances to be similar. However, the portfolio blend generates a higher IR (0.89 vs. 0.59)."


4/ "The securities held exclusively in the portfolio blend (Area 3, Panel A, Fig. 3) have a higher average active return than for those held only in the signal blend (Area 2).
"The portfolio blend securities also reduce active risk, unlike securities for the signal blend."
"The portfolio blend securities also reduce active risk, unlike securities for the signal blend."

5/ "The finding that securities held only in the portfolio blend generate a positive average active return can be largely explained by interaction effects between value and momentum.
"These contextual relationships are also present to varying degrees in other factor pairings."
"These contextual relationships are also present to varying degrees in other factor pairings."


6/ "As a next step, we create portfolios that target a much higher level of factor exposures.
"The signal blend now achieves these high exposures with better diversification, as represented by a higher count percentage of universe securities and lower active share.
"The signal blend now achieves these high exposures with better diversification, as represented by a higher count percentage of universe securities and lower active share.

7/ "The signal blend generates 13% higher IR, as shown in Table 8, with the improvement driven by lower active risk.
"In this case, the interaction effects are overwhelmed by the high concentration and stock-specific risk embedded in the portfolio blend."
"In this case, the interaction effects are overwhelmed by the high concentration and stock-specific risk embedded in the portfolio blend."

8/ "At low-to-moderate [high] levels of factor exposure (starting with the top 50% signal blend portfolio), the portfolio [signal] blend is superior.
"Except for the momentum-volatility combination, similar patterns are found for various two-factor combinations."
"Except for the momentum-volatility combination, similar patterns are found for various two-factor combinations."

9/ Quality = gross profits / total assets
Volatility = 1/σ of trailing 12-month daily total returns
"Due to value’s neg. correlation with both momentum and quality, we observe a lower exposure to value. As previously, we match exposures across the 3 factors in both approaches."
Volatility = 1/σ of trailing 12-month daily total returns
"Due to value’s neg. correlation with both momentum and quality, we observe a lower exposure to value. As previously, we match exposures across the 3 factors in both approaches."

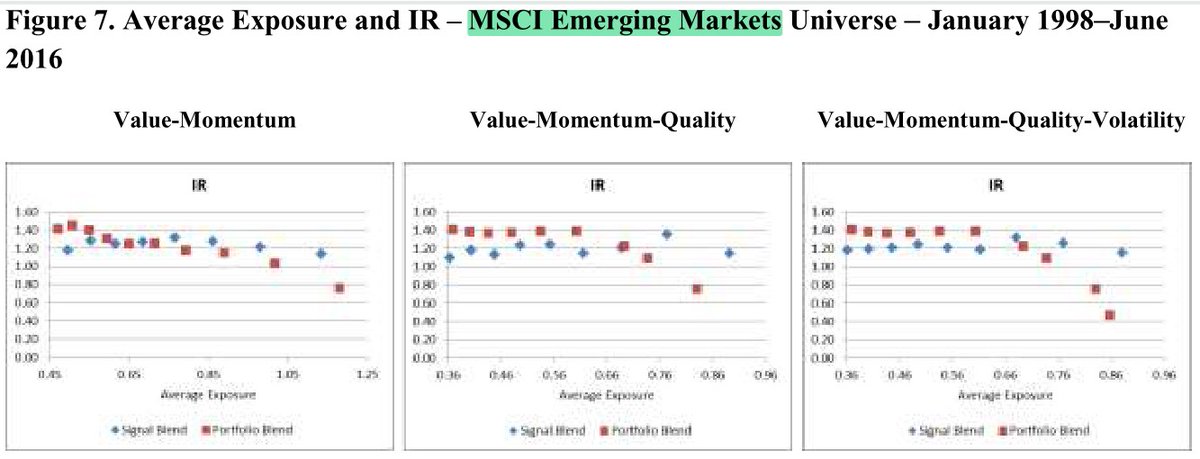
10/ "Figure 5 plots the average factor exposure against information ratio for the three- and four-factor portfolios.
"Overall, we see a pattern that is quite consistent with the pattern observed with the value-momentum combination."
"Overall, we see a pattern that is quite consistent with the pattern observed with the value-momentum combination."

11/ "The results in the U.S. are generally validated when analyzed in other developed and global emerging markets."

12/ "Portfolio blending is more transparent: the building-block framework facilitates cause/effect performance attribution.
"For example, momentum has higher active risk than value (9.32% vs. 6.85%), suggesting that diversification could be improved by balancing active risk."
"For example, momentum has higher active risk than value (9.32% vs. 6.85%), suggesting that diversification could be improved by balancing active risk."

13/ "The way a manager defines, constructs, & implements factor strategies can have a meaningful impact on correlation structure and efficiency of factor capture.
"It is our view that choosing an approach is more appropriately made in the context of a given investment process."
"It is our view that choosing an approach is more appropriately made in the context of a given investment process."

14/ Related research
Long-Only Style Investing: Don't Just Mix, Integrate
Long-Only Style Investing: Don't Just Mix, Integrate
https://twitter.com/ReformedTrader/status/1127035098849660928
• • •
Missing some Tweet in this thread? You can try to
force a refresh