1/ Is Newspaper Coverage of Economic Events Politically Biased? (Lott, Hassett)
"Newspapers give more positive coverage to the same economic news when a Democrats is President than a Republican. When all news is pooled, results are highly significant."
papers.ssrn.com/sol3/papers.cf…
"Newspapers give more positive coverage to the same economic news when a Democrats is President than a Republican. When all news is pooled, results are highly significant."
papers.ssrn.com/sol3/papers.cf…

2/ "In 2004, 98% of CBS’s employee donations went to Democrats, 100% of NBC’s, and 81% of Fox News’.
"Based on citation patterns between politicians and media, most mainstream media outlets examined were closer to the aerage Democrat in Congress than to the median House member."
"Based on citation patterns between politicians and media, most mainstream media outlets examined were closer to the aerage Democrat in Congress than to the median House member."

3/ "To be included, headlines had to directly or indirectly allude to economic data released that day or the day before. They were classified as +, -, neutral, or mixed based upon whether they mentioned these variables as getting better/worse according to systematic criteria."


4/ "Descriptive information from these searches is presented in Table 1.
"But negative coverage could well be justified. Table 1 can’t answer the question of whether the differences in economic performance can explain the differences in news coverage."
"But negative coverage could well be justified. Table 1 can’t answer the question of whether the differences in economic performance can explain the differences in news coverage."


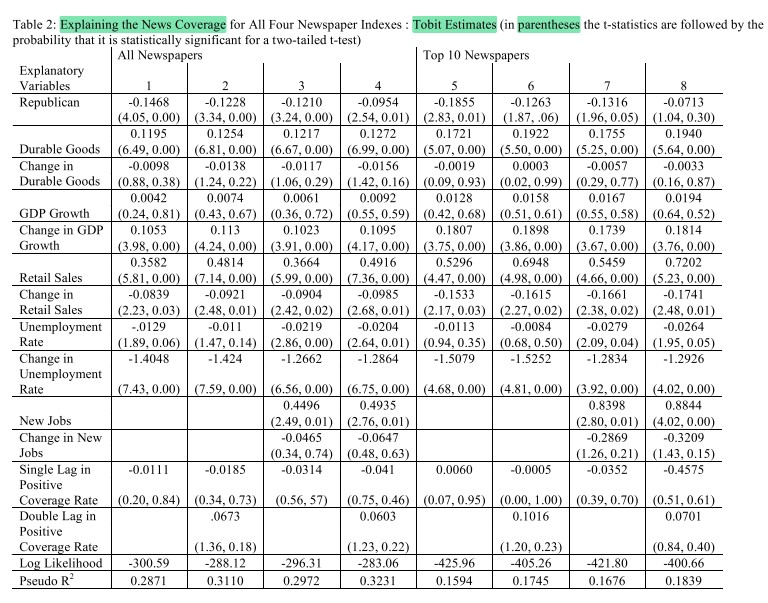
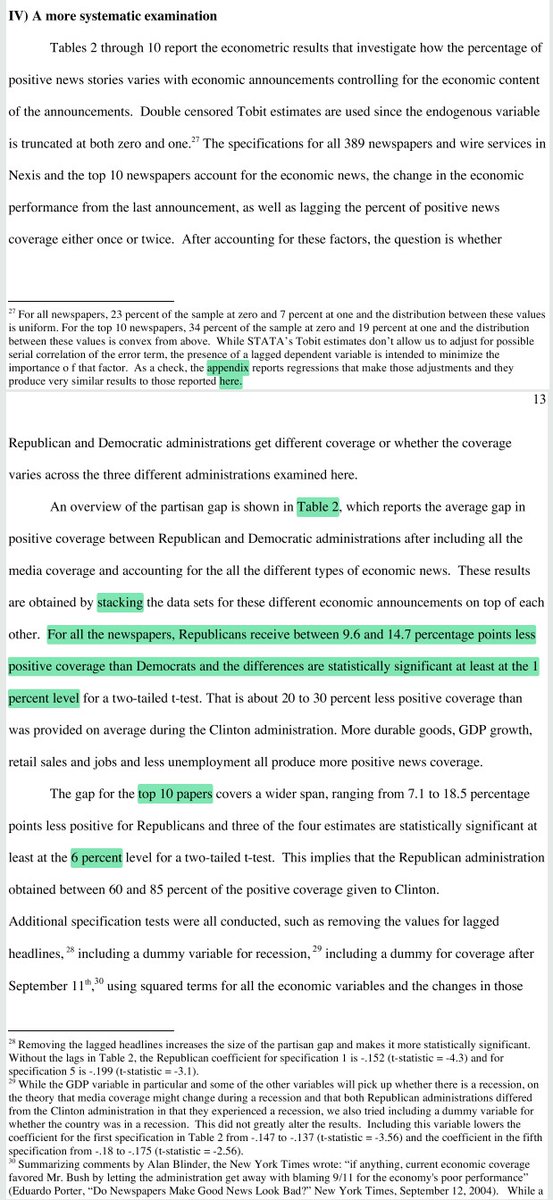
5/ "For all newspapers together, Republicans receive 9.6-14.7 percentage points less positive coverage than Democrats (differences stat. significant at 1%) after controlling for economic content of announcements."
Results for Top 10 are less stat. significant (smaller sample).
Results for Top 10 are less stat. significant (smaller sample).
6/ "Additional specification tests were all conducted but did not alter the basic results:
* removing lagged headlines
* recession dummy
* 9/11 dummy
* excluding AP stories
* 6-month lags for endogenous and control variables
* using squared terms for all variables and changes
* removing lagged headlines
* recession dummy
* 9/11 dummy
* excluding AP stories
* 6-month lags for endogenous and control variables
* using squared terms for all variables and changes


7/ "The next four tables break down the partisan bias by type of economic statistic."
(Results here are less statistically significant than for Table 2, probably due to the smaller samples involved.)
(Results here are less statistically significant than for Table 2, probably due to the smaller samples involved.)


8/ "The Houston Chronicle is the only newspaper that implied any consistent bias towards Republicans, but the effect wasn’t statistically significant."


9/ "For four of the top 10 newspapers and the Associated Press, it was possible to extend the sample back to the beginning of Reagan’s second term in 1985."

10/ "The headlines used by AP closely reflect headlines used by papers that use AP stories.
"After removing AP stories, the specification corresponding to the first regression in Table 2 implied that Republicans still received 16.4 pct pts fewer positive stories (t-stat -4.33)."
"After removing AP stories, the specification corresponding to the first regression in Table 2 implied that Republicans still received 16.4 pct pts fewer positive stories (t-stat -4.33)."

11/ "Despite evidence that daily newspaper readers tend to be either relatively conservative or the same as the general population (Hamilton, 2004, pp. 107-109), the results here indicate that at least among newspapers there is a systematic partisan gap in favor of Democrats."

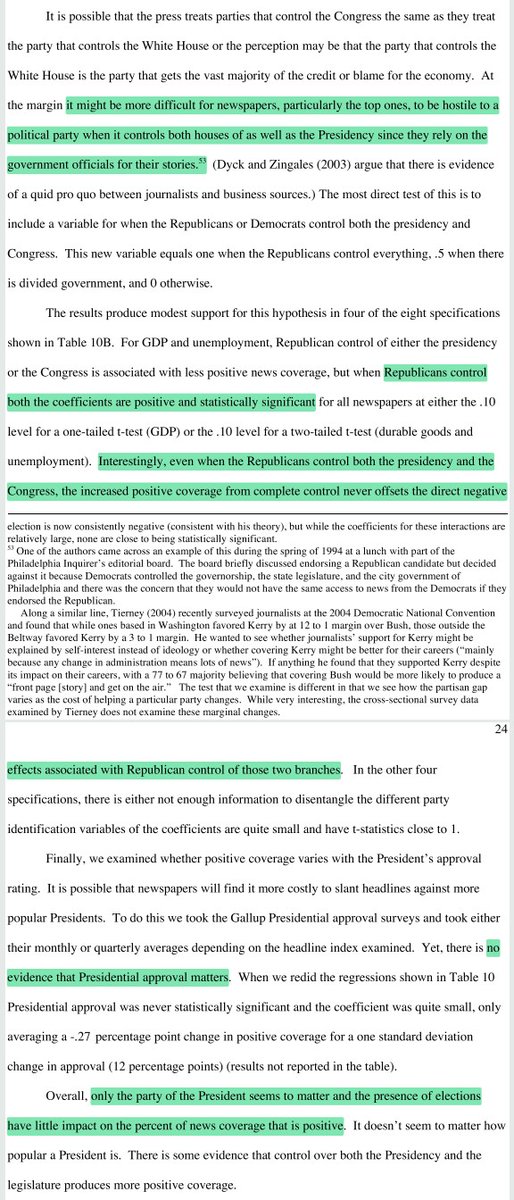
12/ "Interestingly, even when the Republicans control both the presidency and the Congress, the increased positive coverage from complete control never offsets the direct negative effects associated with Republican control of those two branches."

13/ "Gallup Poll has regularly asked whether economic conditions have been getting better or worse.
"By matching survey questions with newspaper headlines, how positively voters evaluate the condition of the economy can be related to changes in how the media covers the economy."
"By matching survey questions with newspaper headlines, how positively voters evaluate the condition of the economy can be related to changes in how the media covers the economy."

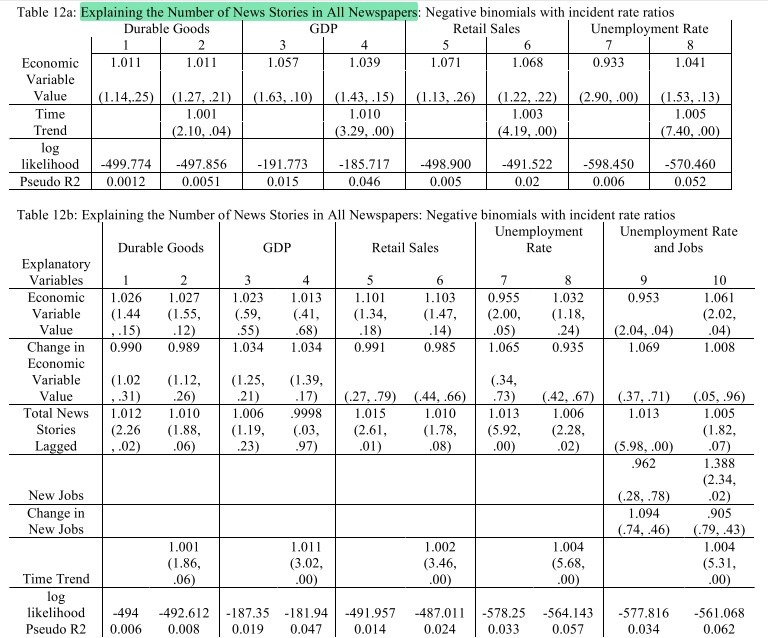
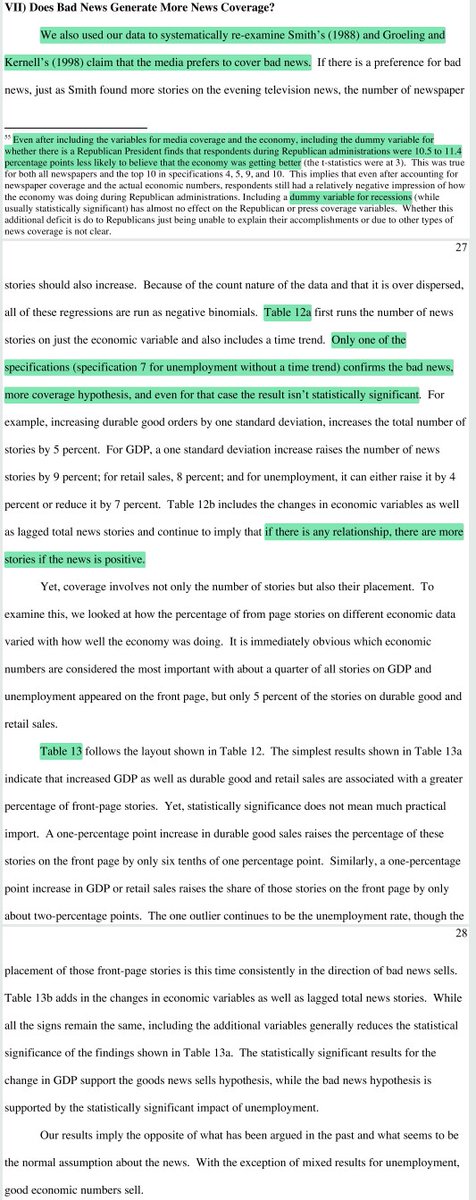
14/ "We also used our data to systematically re-examine Smith’s (1988) and Groeling and Kernell’s (1998) claim that the media prefers to cover bad news.
"If there is any relationship, it is that there are more stories if the news is positive."
"If there is any relationship, it is that there are more stories if the news is positive."

15/ Related reading
In Defense of Troublemakers: The Power of Dissent in Life and Business
Superforecasting
Expert Political Judgment
In Defense of Troublemakers: The Power of Dissent in Life and Business
https://twitter.com/ReformedTrader/status/1368396960688869381
Superforecasting
https://twitter.com/ReformedTrader/status/1326234446668812288
Expert Political Judgment
https://twitter.com/ReformedTrader/status/1368022899131478018
• • •
Missing some Tweet in this thread? You can try to
force a refresh