This Tech. tool keeps you on the right side. Take trades once this gives the go ahead. Until then, don't enter.
SLOW MACD(12,26,9) is a trend & momentum indicator.
S.MACD provides clear buy & sell signals using either "Turning dn or up & Triggering" as well as divergences.
SLOW MACD(12,26,9) is a trend & momentum indicator.
S.MACD provides clear buy & sell signals using either "Turning dn or up & Triggering" as well as divergences.

Always start with higher t/f (WeeK) to align with the current forces. It does not mean, there won't be any counter trend moves for which you need to step down (Day & Hour).
Know the trade taken based on the t/f & accordingly stay for big move(week) or exit quickly (Hour)
Know the trade taken based on the t/f & accordingly stay for big move(week) or exit quickly (Hour)


Having followed most indicators (used to calculate formula & write dn & plot it in graph paper; hence, felt them), you just need S.Macd to make consistent money.
You don't need to make money every hour But like the fishermen, wait patiently for the signal, be it Hour/ day or week
You don't need to make money every hour But like the fishermen, wait patiently for the signal, be it Hour/ day or week


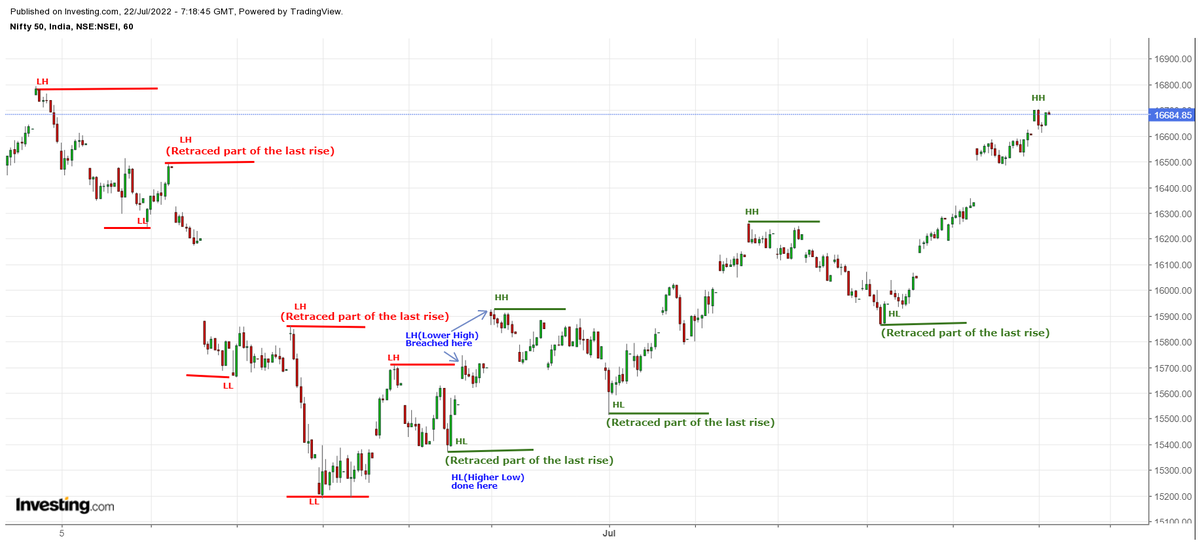
Trend following is this:
You could do HH & HL or LH & LL but you'll miss out much-that's OK for investments.
For a trader, this trend indicator is a true friend; It'll not let you down. It keeps you on right side of trend if only you read them from top(Week) to down(Day & Hour)
You could do HH & HL or LH & LL but you'll miss out much-that's OK for investments.
For a trader, this trend indicator is a true friend; It'll not let you down. It keeps you on right side of trend if only you read them from top(Week) to down(Day & Hour)


Trend doesn't discriminate between motabhai & chotabhai.
When it changes direction, do not fool yourself with fundamentals & news flows. Price is king & it gets reflected as trend.
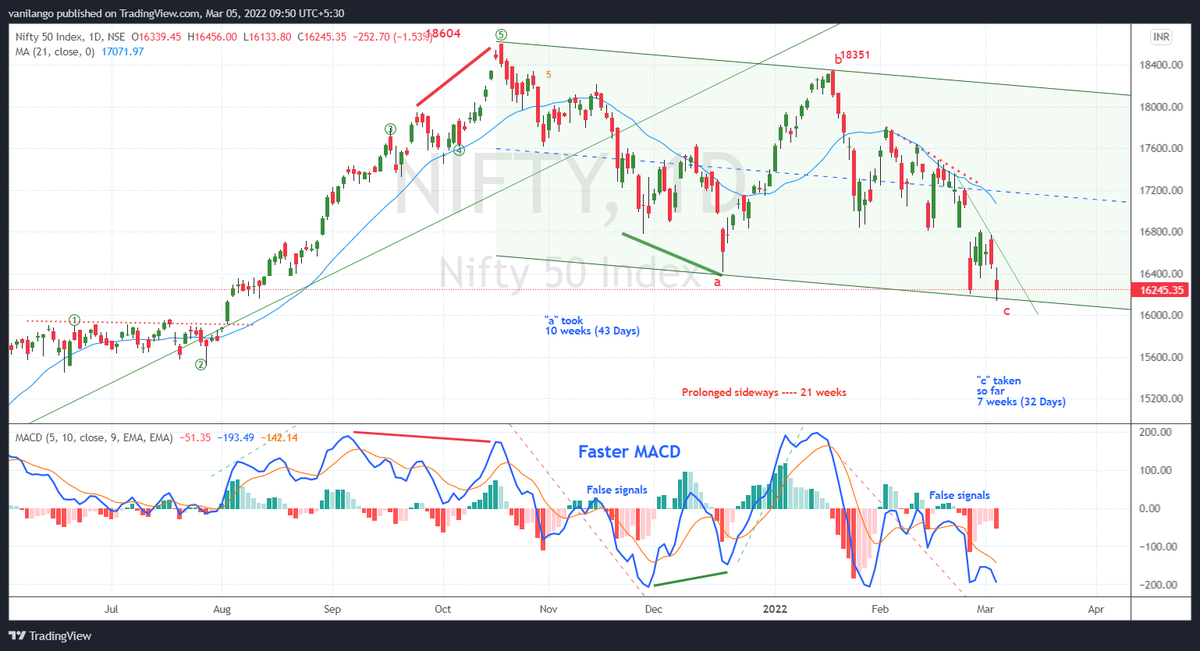
Learn to discriminate between a downtrend & a correction as shown in the week chart.
When it changes direction, do not fool yourself with fundamentals & news flows. Price is king & it gets reflected as trend.
Learn to discriminate between a downtrend & a correction as shown in the week chart.


RSI or Macd ?
It's ok to sit on a debating table & argue. When in business, your money is at stake follow which ever works well. Do not follow MACD just because a good presentation is put forth. IF RSI works & makes money for you, don't abandon cos' you're used to it
Your choice
It's ok to sit on a debating table & argue. When in business, your money is at stake follow which ever works well. Do not follow MACD just because a good presentation is put forth. IF RSI works & makes money for you, don't abandon cos' you're used to it
Your choice
Trend following for Intraday/positional trading:
#Tataconsum
Week trend: UP & above trigger(Not shown here)
Day trend: UP & above trigger
Hour trend: UP since 19th 13.15Hrs & triggered on 20th
15-Min trend: Trending up since 19th 12.15 Hrs.
Once 15min./Hour trigger down, exit.
#Tataconsum
Week trend: UP & above trigger(Not shown here)
Day trend: UP & above trigger
Hour trend: UP since 19th 13.15Hrs & triggered on 20th
15-Min trend: Trending up since 19th 12.15 Hrs.
Once 15min./Hour trigger down, exit.

Trend following for Intraday/positional trading:
#SunPharma
This template for safe trading
Pharma sector in uptrend;
Better stocks there-Cipla, Cadilla, Divis, etc; still this most under performing stock gave good returns in ST trading.
Remember: To take profits off the table.
#SunPharma
This template for safe trading
Pharma sector in uptrend;
Better stocks there-Cipla, Cadilla, Divis, etc; still this most under performing stock gave good returns in ST trading.
Remember: To take profits off the table.

Become independent.
This template for trading but week/ Day for investments.
It works. You need to believe in them & have patience.
Presently, market consolidating. Don't attempt anything against current downtrend(corrective)
Once you get the "all clear", right position to trade
This template for trading but week/ Day for investments.
It works. You need to believe in them & have patience.
Presently, market consolidating. Don't attempt anything against current downtrend(corrective)
Once you get the "all clear", right position to trade

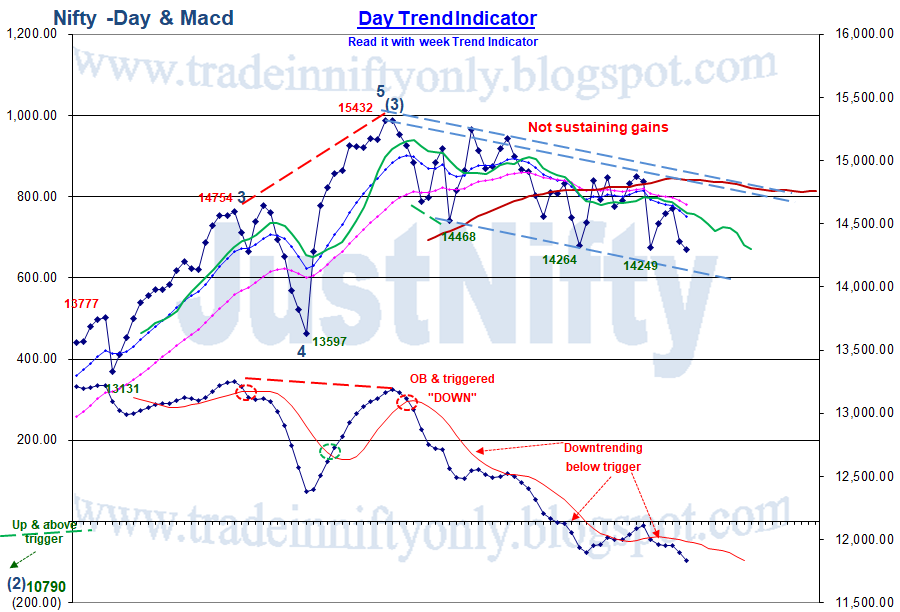
Remember it was suggested that IT stocks have topped out few weeks ago. It was based on this trend indicator
Since then, IT stocks rose to form -ve divergence. How do you trade, then ?
Once you get week signal, you, then, look for signal from Day & hour combination to give "sell"
Since then, IT stocks rose to form -ve divergence. How do you trade, then ?
Once you get week signal, you, then, look for signal from Day & hour combination to give "sell"


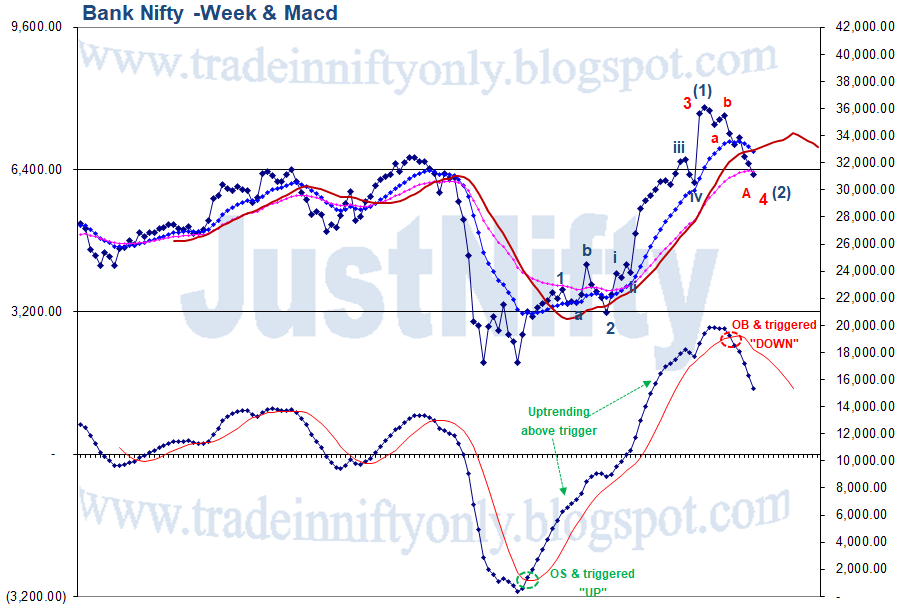
Remember it was suggested that FMCG stocks have bottomed out few weeks ago. It was based on this trend indicator.
Now, Day suggesting a sell with Hour displaying -ve divergence.
Stocks like #Hdfc, #Hindunilvr, #Asianpaint (MF holdings) have some smooth movements.
Now, Day suggesting a sell with Hour displaying -ve divergence.
Stocks like #Hdfc, #Hindunilvr, #Asianpaint (MF holdings) have some smooth movements.


This Tech. tool keeps you on right side. Take trades once it gives the go ahead
SLOW MACD(12,26,9) is a trend & momentum indicator
It provides clear buy & sell signals using either "Turning down or up & Triggering" & divergences
Current buy signal producing almost 750 points🙏
SLOW MACD(12,26,9) is a trend & momentum indicator
It provides clear buy & sell signals using either "Turning down or up & Triggering" & divergences
Current buy signal producing almost 750 points🙏

One of the old, classic Technical tool:
MACD - Moving Average Convergence Divergence.
Using it for many years with 3 t/f, week/Day/Hour - produces good results when you patiently wait for combined signals. Other times, use it with small exposure.
Remember: Market cycles repeat
MACD - Moving Average Convergence Divergence.
Using it for many years with 3 t/f, week/Day/Hour - produces good results when you patiently wait for combined signals. Other times, use it with small exposure.
Remember: Market cycles repeat
• • •
Missing some Tweet in this thread? You can try to
force a refresh