Chennai Test positive rate all time high 23.8% today crossed 20% forecasted by model last week. It could cross 25% in 3-4 day. Forecasting model shows TN would cross 1 Lakh active cases in 5 days, Chennai 40K in a week. Public support critical at this moment #StopTheSpread 1/8 


https://twitter.com/vijay27anand/status/1382222563464548352

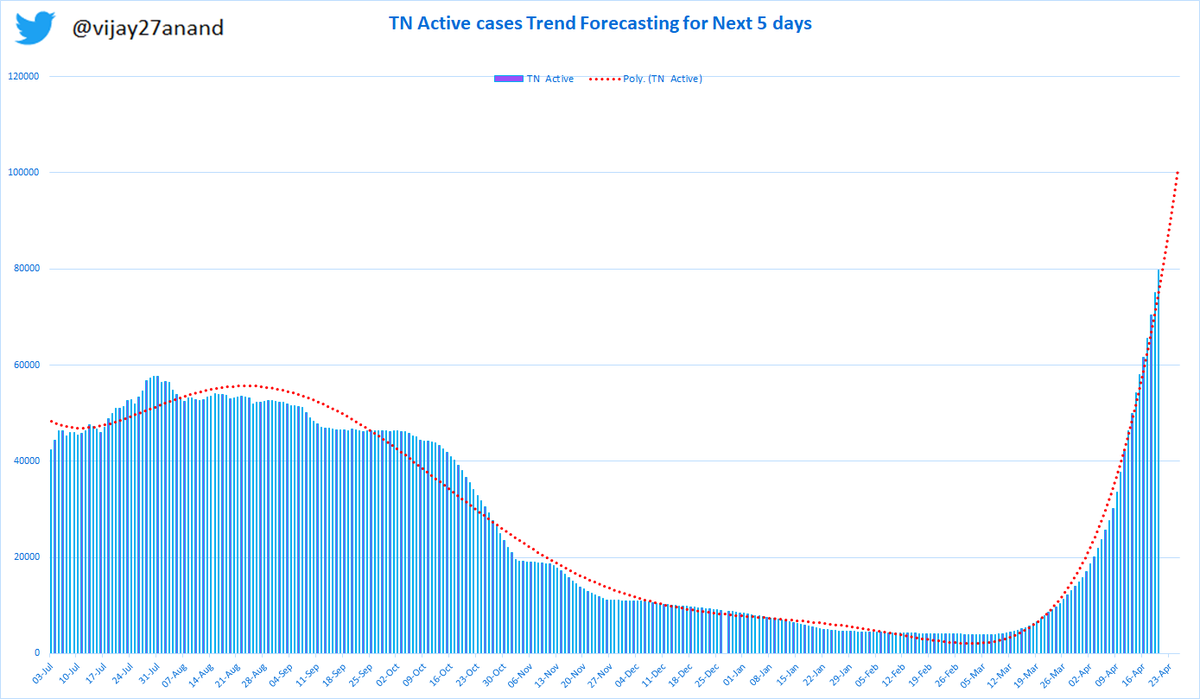
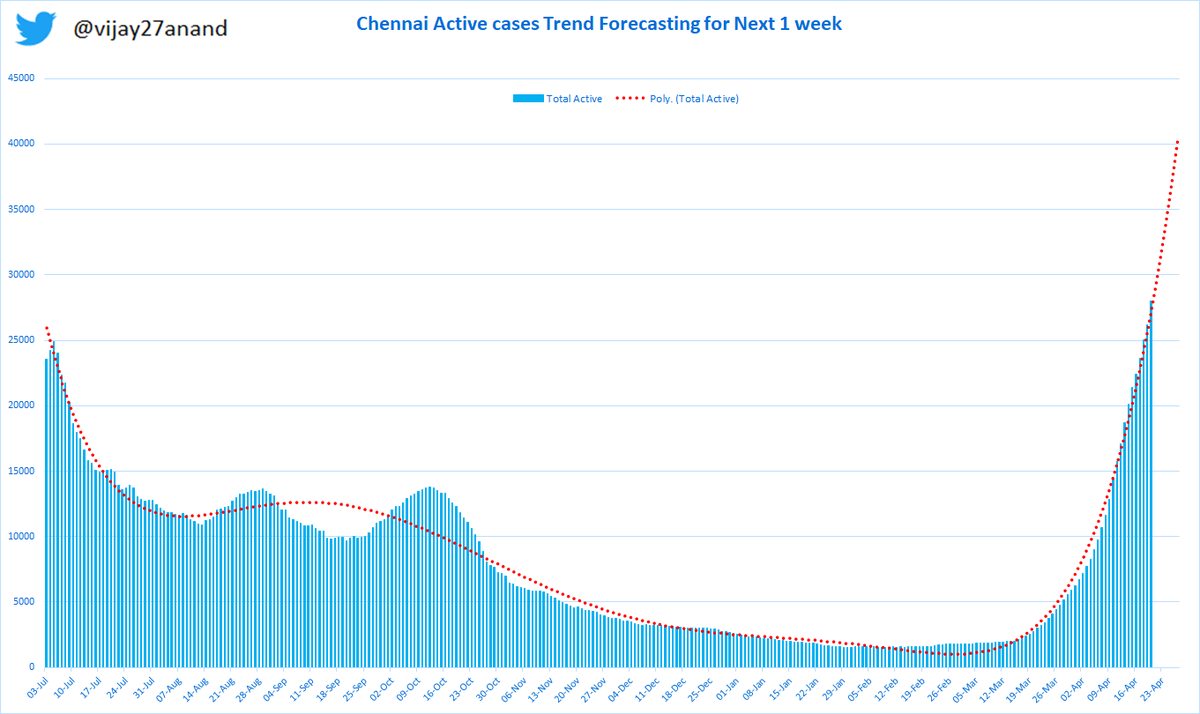
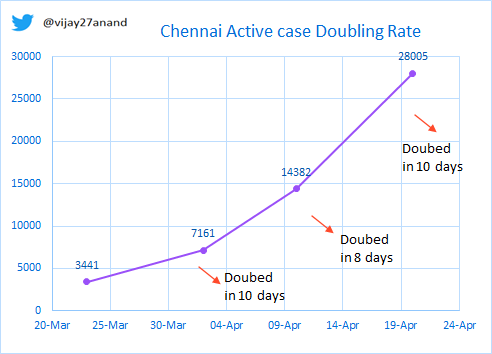
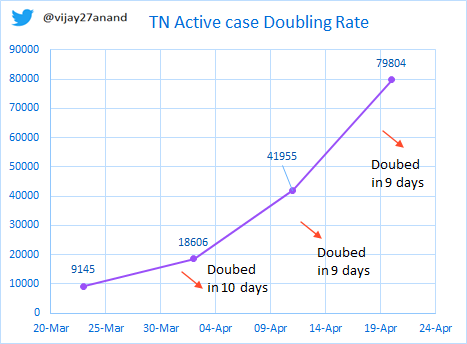
10 days growth rate of active case in Chennai at 95% and TN at 112%. Doubling Rate of Active cases for TN is now 9 days and Chennai at 10 days.
So rest of TN also growing faster now. 2/8 @ChennaiRains @kprabhdeep @rameshlaus @ashokhavarshini @karthikeyannews @karthickselvaa

So rest of TN also growing faster now. 2/8 @ChennaiRains @kprabhdeep @rameshlaus @ashokhavarshini @karthikeyannews @karthickselvaa
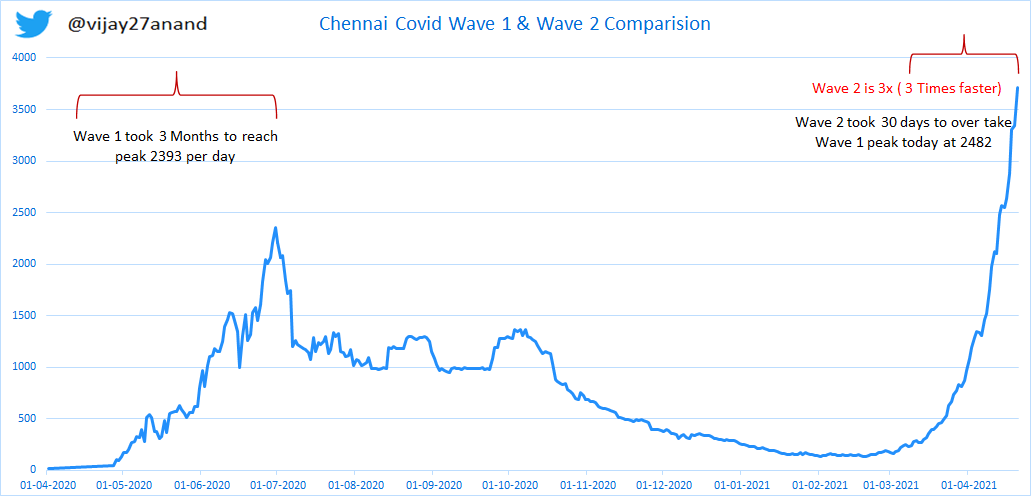
Comparing Chennai Wave 1 and Wave 2.
Test positive rate is now all time high 23.8% crossed last year peak of 21% took 45 days to overtake last year peak TPR, and it took 30 days to cross daily new case of last year peak 2393. The curve is still parabolic. 3/8 #COVIDSecondWave
Test positive rate is now all time high 23.8% crossed last year peak of 21% took 45 days to overtake last year peak TPR, and it took 30 days to cross daily new case of last year peak 2393. The curve is still parabolic. 3/8 #COVIDSecondWave
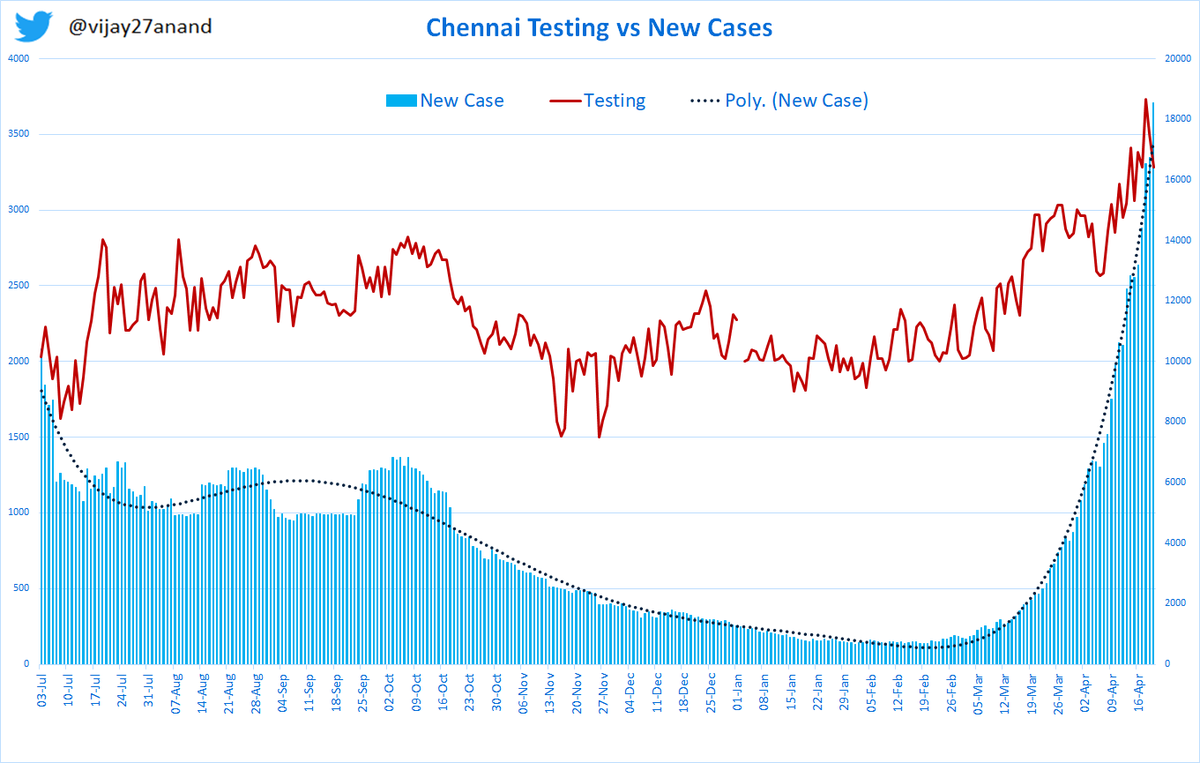
Testing trends: TN/Chennai testing has increased by 29%. TN maximum testing to 1.1Lakhs and Chennai max at 18.6K. 4/8 


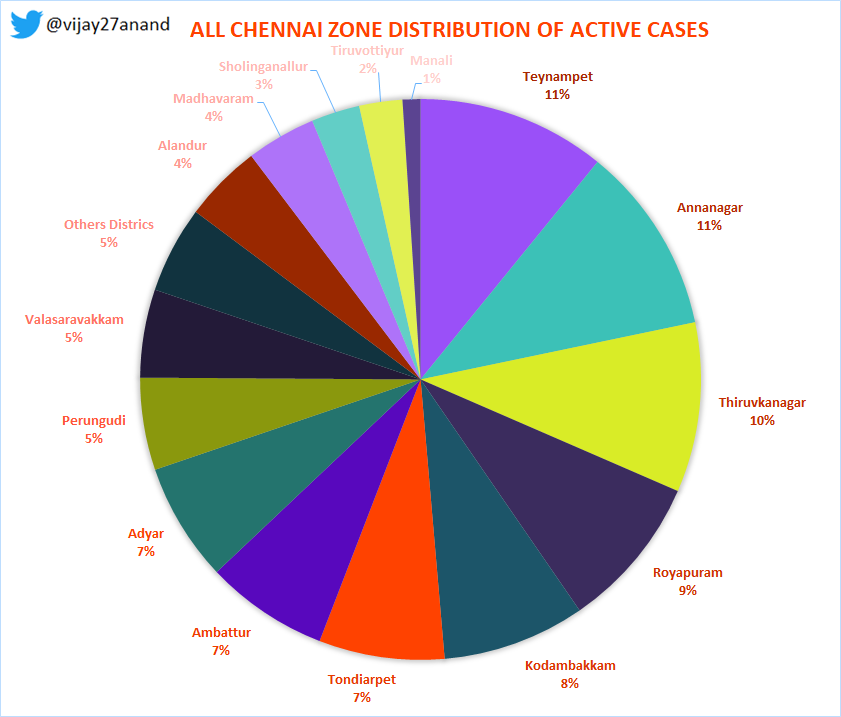
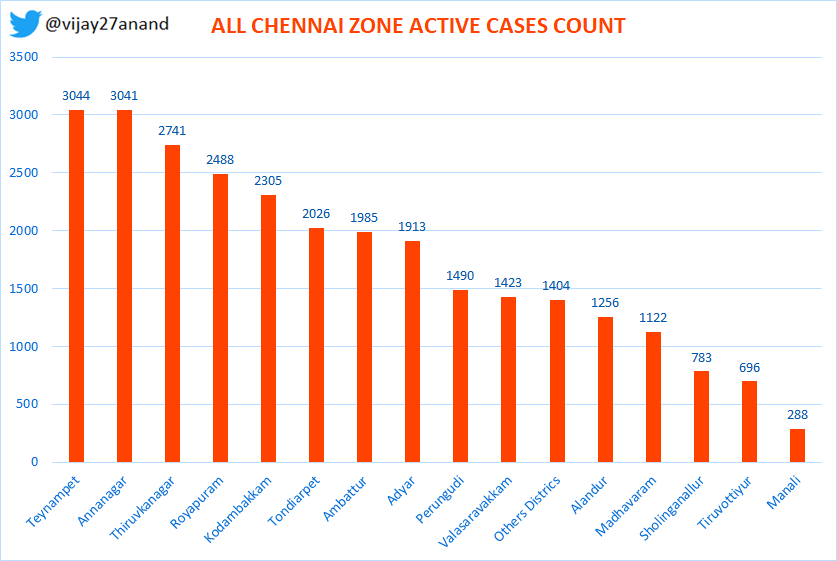
Chennai all zone status
1) Teyampet, Annanagar crossed 3K active cases
2) Thiruvika, Royapuram 2500 active cases
3) Kodambakam, 2300, these 5 zone contirbute 50% of active cases
4) Tondiarpet , Adyar close to 2000
5/8

1) Teyampet, Annanagar crossed 3K active cases
2) Thiruvika, Royapuram 2500 active cases
3) Kodambakam, 2300, these 5 zone contirbute 50% of active cases
4) Tondiarpet , Adyar close to 2000
5/8
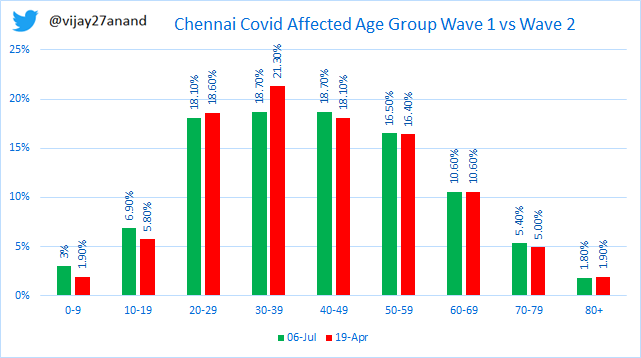
#Chennai comparison of age group of covid affected people during 1st Wave vs 2nd Wave.
1) 6-Jul-20 & 18-Apr-21 had similar active case of 25K
2) Age group of 20 to 39 has significant increase by 3%
3) Age group 40-79 shows a decline .
6/8
1) 6-Jul-20 & 18-Apr-21 had similar active case of 25K
2) Age group of 20 to 39 has significant increase by 3%
3) Age group 40-79 shows a decline .
6/8
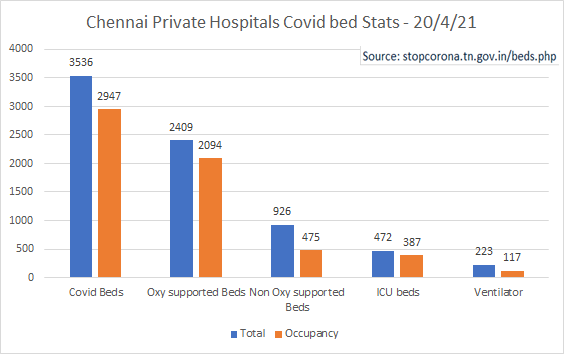
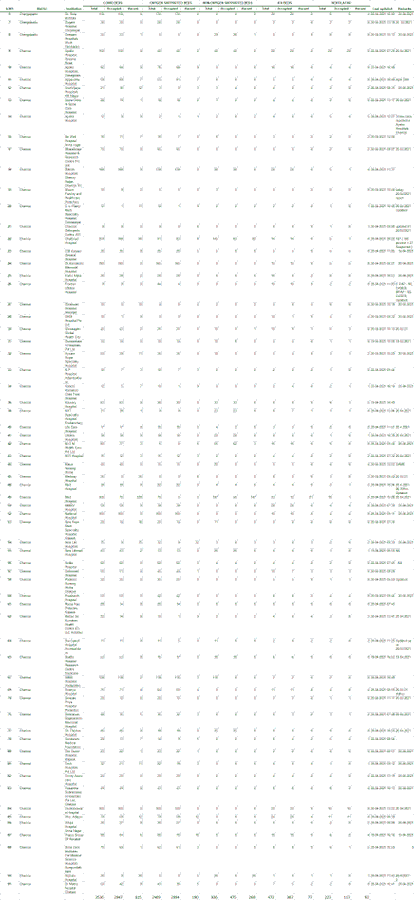
#Chennai Private hospital bed status:
Source: stopcorona.tn.gov.in/beds.php (Removed Medical college hospitals)
Overall 83% occupied, Oxy beds 87%, ICU 82%, Ventilators 52%
Please verify with hospital before you go, or contact Chennai Corp helpline
7/8


Source: stopcorona.tn.gov.in/beds.php (Removed Medical college hospitals)
Overall 83% occupied, Oxy beds 87%, ICU 82%, Ventilators 52%
Please verify with hospital before you go, or contact Chennai Corp helpline
7/8

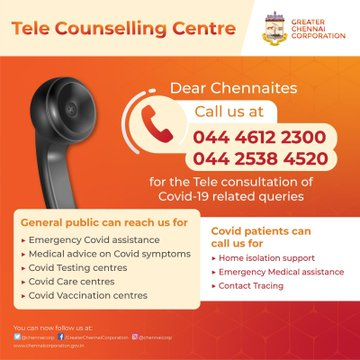
Public support is very critical at this point to flatten the curve for Chennai and TamilNadu. WearAmask, maintain distancing of 6 feet, make others wear a mask before speaking, avoid indoor poor ventilated space. If any symptoms isolate/test.
Together we can stop the spread.
8/8
Together we can stop the spread.
8/8
• • •
Missing some Tweet in this thread? You can try to
force a refresh


