
I do Data Analytics & helped common people across world during #Covid times in TN/India/World with Data. Opinion are personal doesn't represent any organization
 Below chart showing the rate of daily recovery is now greater than the rate of daily new cases, showing the cases have peaked in Chennai. 2/14
 ICU occupancy remains stable
 ICU trend is also raising now.


 1st Dose vaccination Population %

 2/11
2/11


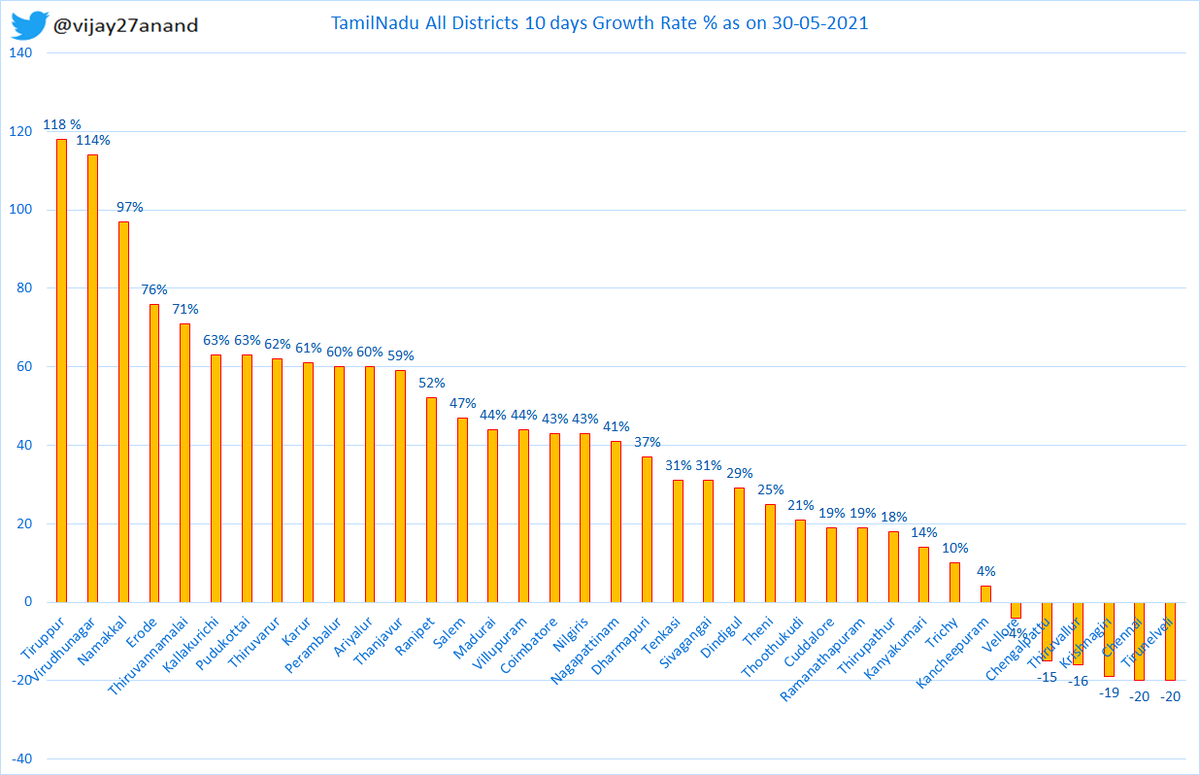
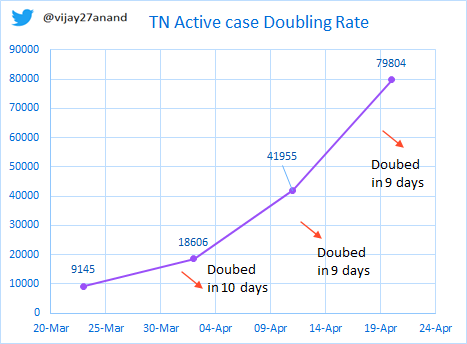
 10 days growth rate of active case in Chennai at 95% and TN at 112%. Doubling Rate of Active cases for TN is now 9 days and Chennai at 10 days.
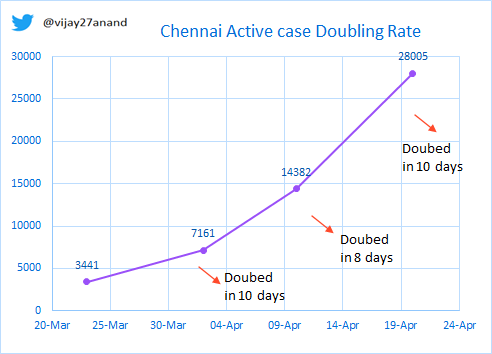
 1)60-69 age group reduced significantly 14.39% to 11.05%


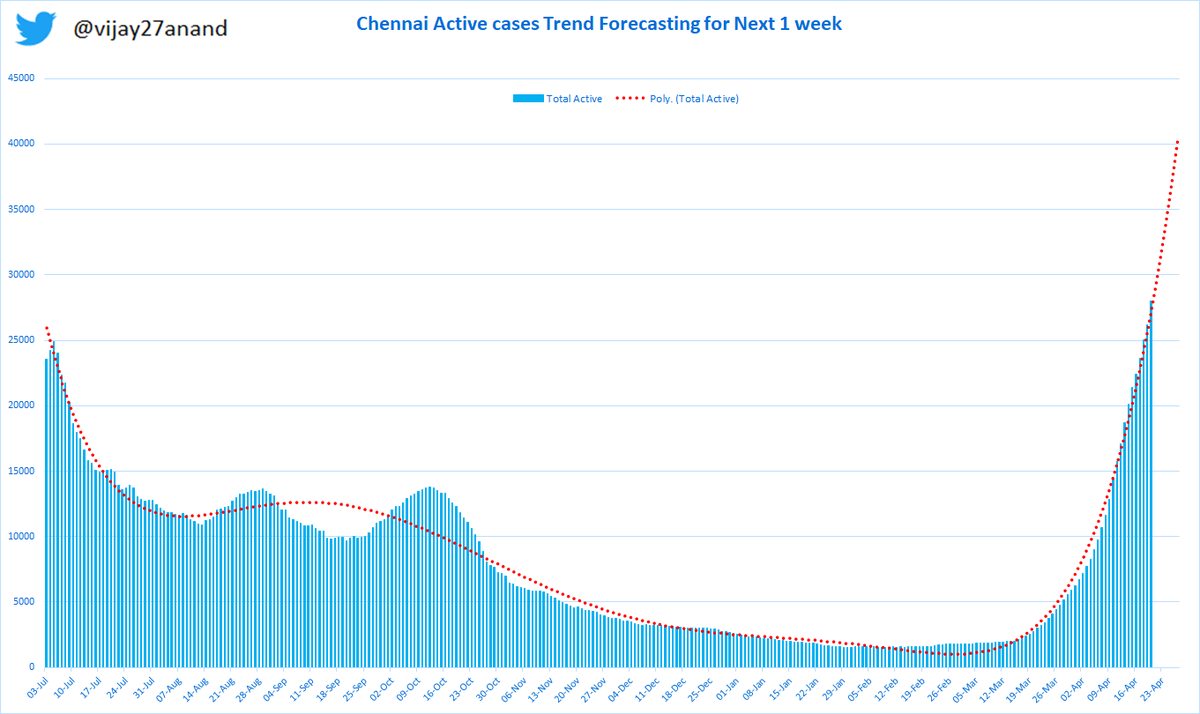
 1) Chennai - Increasing again


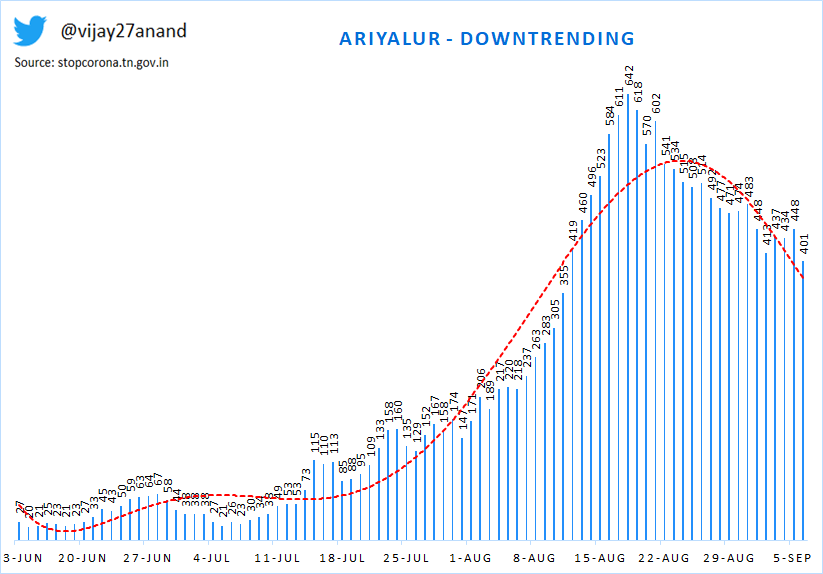
 Chennai - downtrending
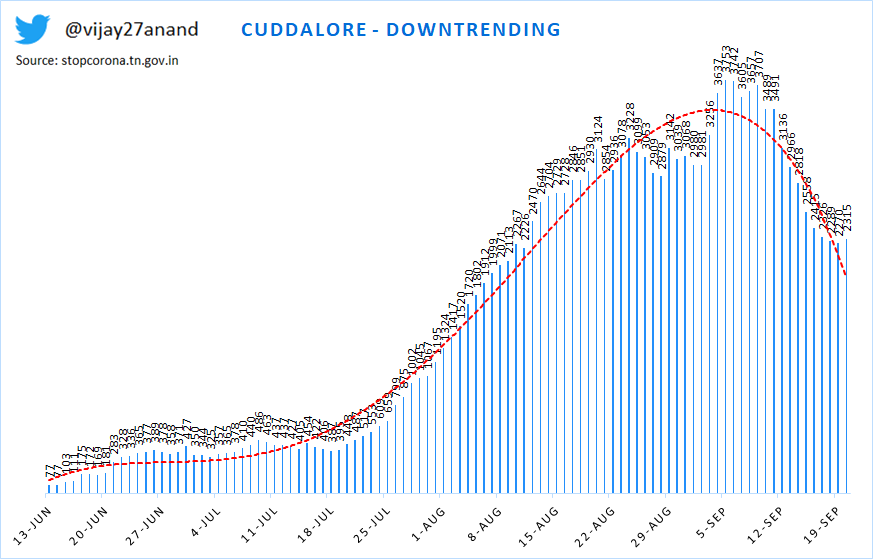


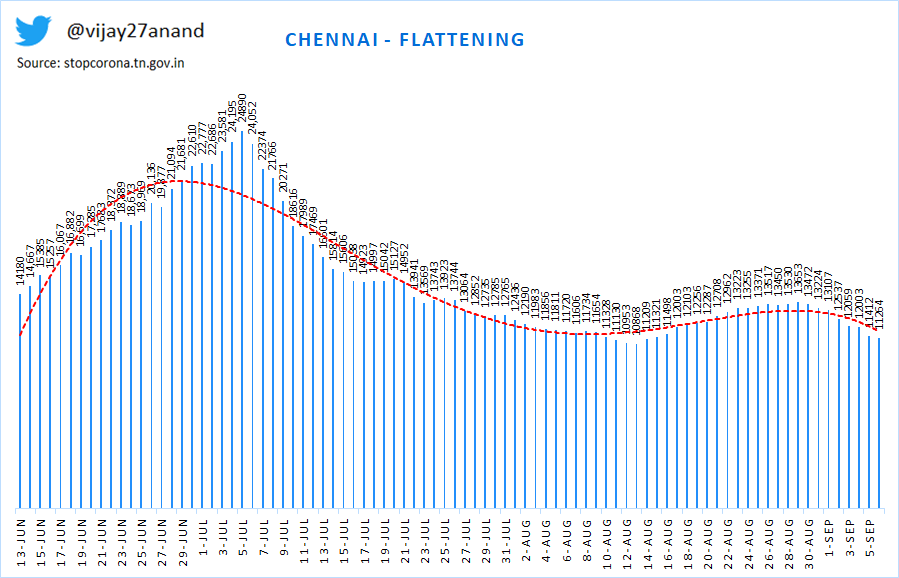
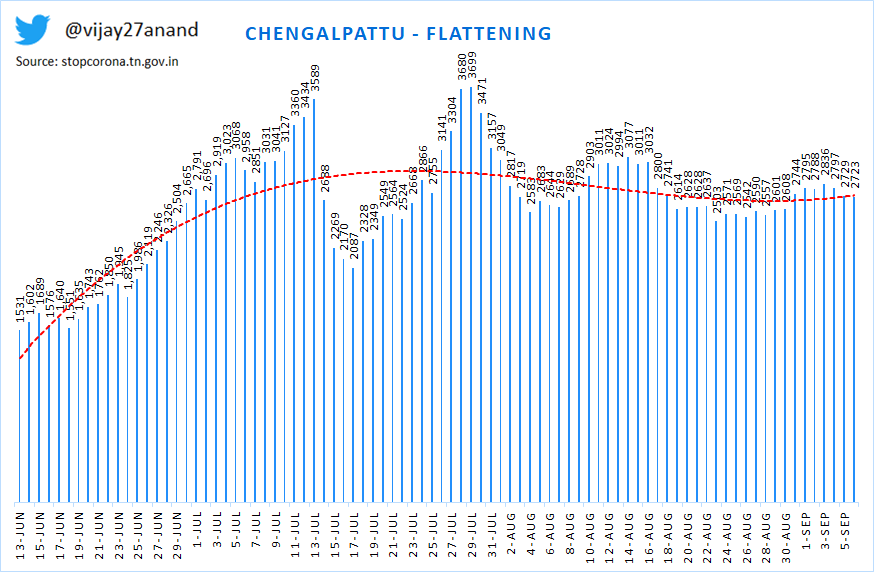
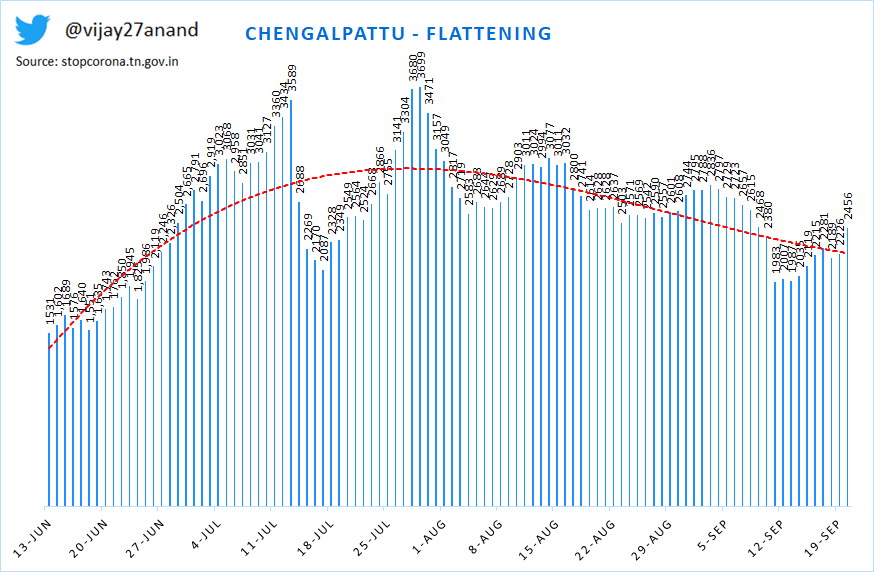
 1) Chennai - flattening
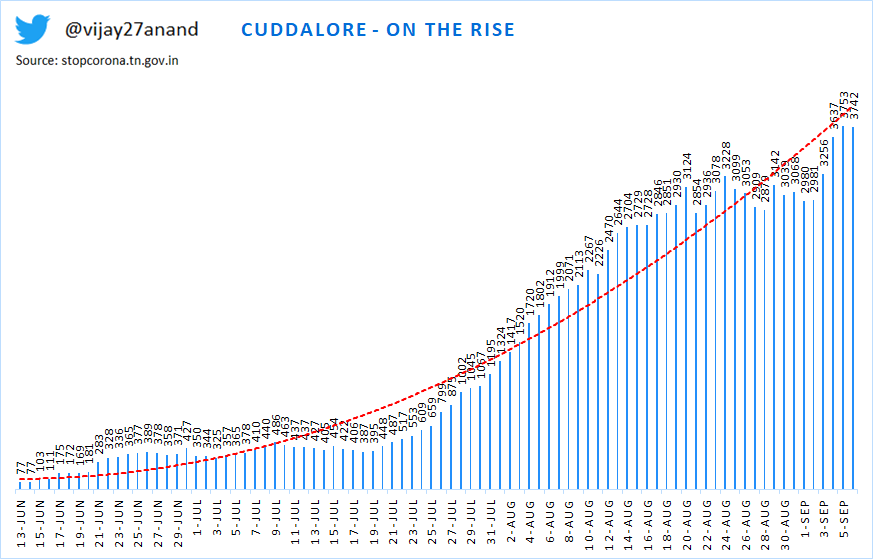


 Some facts:
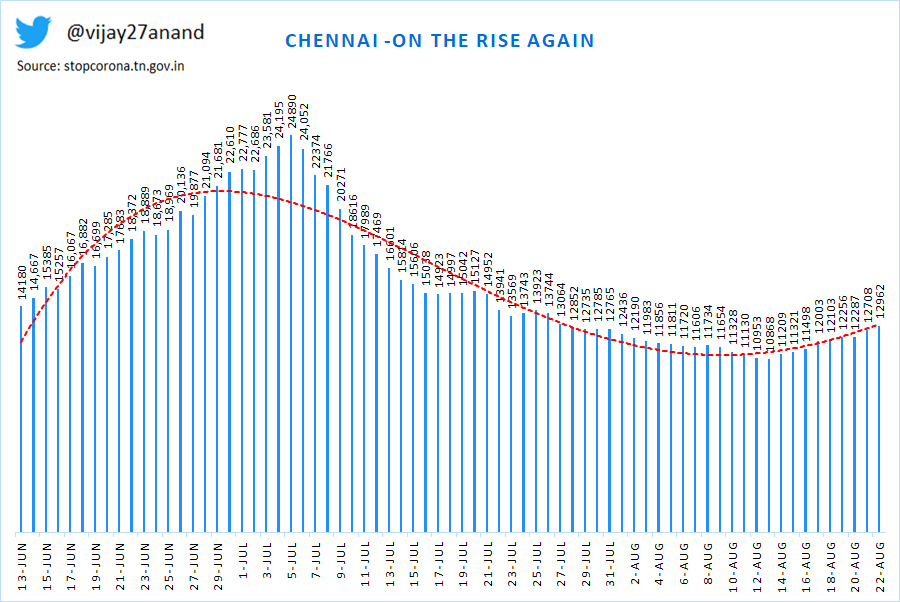
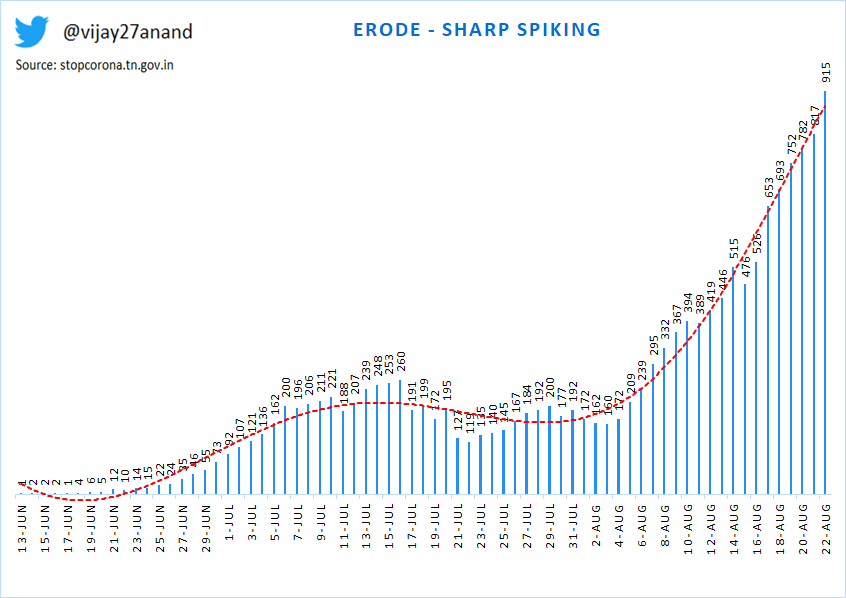
 1) Chennai -On the rise again
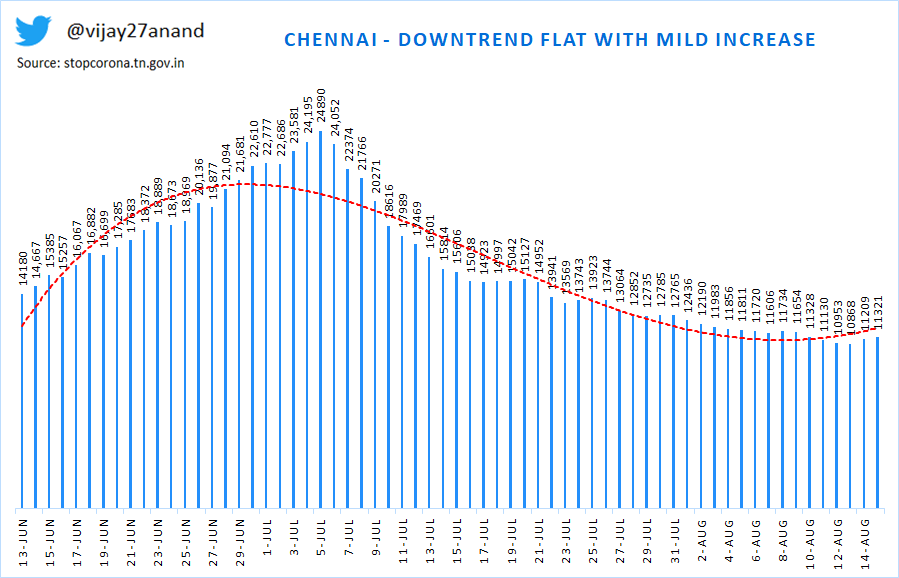
 1)Chennai-Downtrend flat mild increase


 North Chennai
 2) Diabetes is reported in 70% of people. Within that Type-2 diabetes are reported in 61% of people.