Every Friday, the Spain's daily report includes a test done/positivity graph.

It allows us to directly check test policy Vs perceived epidemic.

Apart from the yet officially unexplained partial relation between them (more test, more positivity), we can check trends.
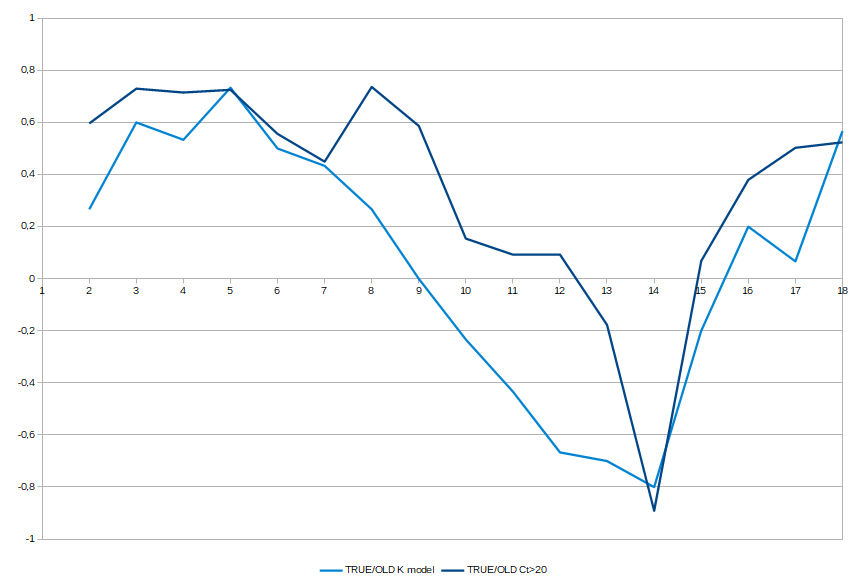
While positivity follows a harmonic waving, we observe 2 prominent abrupt spikes in testing, unrelated to any trend change in positivity.
1st is JUST the week before Xmas, 2nd the week before Easter.
How appropriate.

Just preforming the Irresponsible behaviour during holidays.
Now we're under extra test pressure, the Easter Bump, the little valley is due to holiday testing cease, and inner political issue (Madrid elections) is to blame for the delayed decrease.
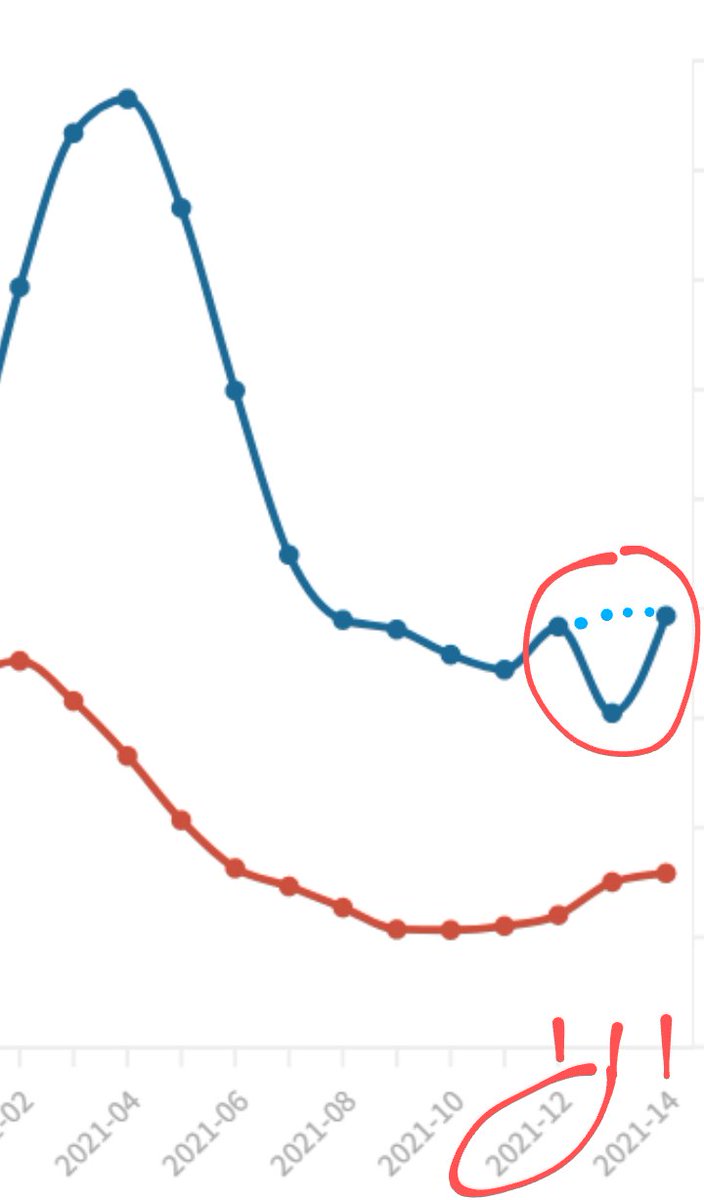
The current Easter spike was shamelessly announced by our expert: "a LITTLE wave may happen this holidays"
Of course it happened, it wasn't predicted, but scheduled.

We also 'predicted' it, they told us they were creating it.

Test is just politics.
Let's finish it.

• • •

Missing some Tweet in this thread? You can try to force a refresh
 

Keep Current with plaforscience

plaforscience Profile picture

Stay in touch and get notified when new unrolls are available from this author!

Read all threads

This Thread may be Removed Anytime!

PDF

Twitter may remove this content at anytime! Save it as PDF for later use!

Try unrolling a thread yourself!

how to unroll video
  1. Follow @ThreadReaderApp to mention us!

  2. From a Twitter thread mention us with a keyword "unroll"
@threadreaderapp unroll

Practice here first or read more on our help page!

More from @plaforscience

19 Apr
We've refined a little more our Old Fake estimate as function of Ct values.
Madrid dataset we use included 3 Ct frames, <20, 20-30 & >30.
Our equation changes slightly:

%Old positivity=(Ct-28)/3

It brings a good approximate to calculated Old Detection:

Method used for this refinement was considering all the Ct>20 as true positive and considering Average Ct for >20.

We observe the calculated Old Positivity fits with this average Ct, and we used to estimate the relation.
Our equation also models that every point the Ct Average grows, the Old Positivity increases ~30%, so around Ct~31 and over your detecting almost only Old Fake Positives.
Read 4 tweets
16 Apr
RELEVANT RESULT

We've found that False (Old) PCR positivity is a function of PCR average Ct.
Fake Old Cases are created if average Ct is over ~27.5
Then on, Fake proportion grows at ~30% for each average Ct point.
At AvCt>31 we will have ~only old fake cases.

The method:
THREAD
We have Madrid dataset with PCR&Antigen test results and PCR Ct averages.

Using them we can calculate the positivities found with each of the methods. We observe they're similar, but PCR is higher with lower prevalence, and Ant with higher prevalence.

Let's compare them.
If we find their proportions we notice PCR is almost all the way giving MUCH HIGHER positivities than Antigen.
They could have same rate (1) if test were technically equal, OR a constant disproportion due to better specificity/sensitivity.
But changing over time makes NO SENSE.
Read 15 tweets
15 Apr
Accepting PCR as the Gold Standard because it brings higher positive rates is like choosing a thermometer because it sometimes gives higher temperatures.

PCR/Antigen positivities is NOT constant, varies from ~1/1 to higher than 2/1

That's NOT better detection, but fraudulent +
In our research on Madrid's Ct data (amazing results soon!), we needed the best sensitivity&especificity actual values for PCR&Antigen tests.

It's amazing how studies comparing both ASSUME PCR is the ruler, despite the fact that ELISA results use to align better with antigen's.
When they find low prevalence 2x PCR/Antigen positivities, they never think, hey, it COULD be PCR is detecting too much

Like they didn't know high Ct PCR catches lots of viral non infective fragments

Why could any test get better(or worse) depending on prevalence?!
Read 5 tweets
13 Apr
If we check Europe excess death, we see winter seasonal epidemic is done&gone
Current fear bubble&restrictions rush is a Human Artifact politically created thru testing from mid February on
How can it be Armageddon when there's no excess death or even lesser deaths than expected? Image
Of course excess death is NOT the Epidemic, lots of unexpected deaths are occurring due to Covid madness. But they're flat in time, a ~constant background, following the all cause deaths pattern.
The WAVING in excess death will relate the shape of epidemic death, not its height.
The good January correlation death/cases is due to a flat test pressure, as u can see in the most populated countries testing graphics
True trend was detected

Once basal phase was reached, testing pointed slightly upwards, with strong growths in France and TESTING MADNESS in UK ImageImage
Read 4 tweets
11 Apr
Apart for the amazing confirmation of the existence of OLD PCR+ noted as cases, we can use the official data on cases detected for test type to do some interesting analysis.

1st wave was obviously a PCR issue, not interesting except for little scale due to lower testing.
Zooming in 2nd&3rd Waves we observe a CLEAR disproportion between them, depending on test type.
2nd wave was over 2/3 of 3rd thru PCR, but less than 1/3 thru antigen!!

The MUST be same proportion. Why is there EXTRA PCR+ positivity?!

We've talked about it LONG AGO:
OLD cases.
That shows even clearer when you draw observed positivity for PCR&Antigen.

3rd wave, the winter seasonal expected wave, shows similar positivities, meaning every kind of test founding the same, but 2nd wave is unbalanced, with only a 60% of positivity thru Antigen.
Read 4 tweets
11 Apr
THIS IS VERY IMPORTANT!

We finally get CONFIRMATION that our estimate of Fake Epidemic Creation thru detection of OLD PCR+, non infective, noted as cases, IS CORRECT.

We get access to a new data set, number of + for test technique, that validate our method's values.

Thread:
You can find the model in the link.

We wanted to know the share of PCR+ that were OLD non infectious, using Ct data; and thus finding true Epidemic.

For model development we needed to calculate the number of test that were official positive by type.

The premise is that any test MUST find same TRUE positivity. Then you can develope equations:
PCR+=(True+)+(False+)+(Old+)
ANTIGEN+=(True+)+(False+)

Solving, we get the number of test by type that MODEL PREDICTS must have been officially positive.

Highlighted in foresee graph:
Read 10 tweets

Did Thread Reader help you today?

Support us! We are indie developers!


This site is made by just two indie developers on a laptop doing marketing, support and development! Read more about the story.

Become a Premium Member ($3/month or $30/year) and get exclusive features!

Become Premium

Too expensive? Make a small donation by buying us coffee ($5) or help with server cost ($10)

Donate via Paypal Become our Patreon

Thank you for your support!

Follow Us on Twitter!