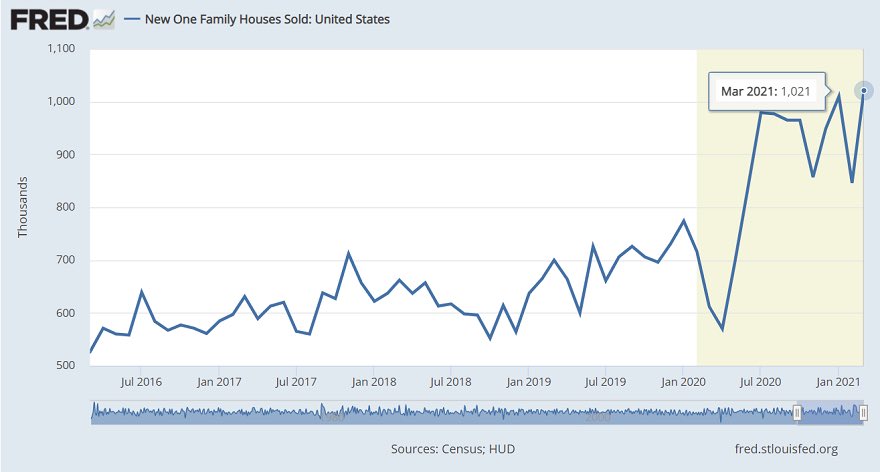
Remember when people were worried about a W recovery ππ€£, I donβt think this was it. Honestly, this last report was so good I want to see if it sticks because the new home sales report can be wild month to monthβhowever, those revisions π₯.
1/2 Each dip in the median sales price of new homes has been interpreted as the bubble popping for many years. For a while, when a clear trend of a median sales price declined, they were all in with the crash. However, (Remember Reading Is A Good Thing) they didn't know about
2/2 The impact of falling median sq ft of homes being solid impacting the price data. Like always, once a crash cult, always a crash cult, they never want to grow up; they want to be a crash cult kid forever. π
It's so different this time around, but the blood lust for something negative on Twitter is too good to pass up. Since I knew people would use the cash-out data this way, I already got ahead of that housingwire.com/articles/are-wβ¦
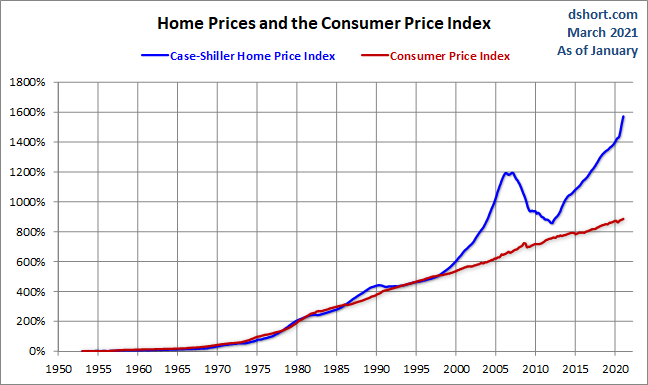
To be very fair to everyone. They don't have the financial background to know how different it is. This is basically a 2.0 version of people using nominal home prices getting back to 2006 levels and calling for the crash, which was a favorite of crash cult twitter.
This is why having a stock trader mentality for housing has been a disaster and normal Americans don't think of housing this way. This is a big reason why the bubble boys failed for so long. Housing is the cost of shelter, not an investment.
Remember, the worst stock people we have in America are all gold bugs because none of these people are actually bearish. They just troll America until they go into the afterlife. They literally missed the best opp in stocks ever, but they didn't because they were all long.
Once you realize it's all a trolling act, then you realize that it's such a sad way to live every day. However, don't feel bad for these people. They were always all long for this. They made money like everyone else. πΊπΈπͺπ½ππ₯
#NewHomeSales
Years 2020-2024
Just remember, this number will be revised lower, but still, don't ever talk trash about demographics ever again πΊπΈπͺπ½ππ₯
#NewHomeSales
If you want to stay away from the headline noise, this is what you want to track; as long as the 3-month average is running below 4.3%, everything is doing great. This did not happen once during the years 2008-2019. Today, 3MA 3.83 months
#NewHomeSales
Even when you see some revisions to this headline print, you can still see how different things are for housing starting in 2020. This is mother demographics flexing her muscle.
New home sales coming out later today. This data line had gone straight parabolic last year, so it has moderated faster than the existing home sales market. Remember, don't fall in love with the headline number; always follow revision trends.
As always, the number 1 housing data line we have in America is the monthly supply chart for new homes; the 3-month average is still below 4.3 months, which means life is good for the builders no matter how high lumber prices are rising.
That low monthly supply which never really happened once during the years 2008-2019, explains why the builder confidence is still good. Don't overthink this; it's always about demand, and for now, lumber hasn't changed that too much.