Correlation is a key ingredient in the portfolio construction process.
If used correctly, it can be a powerful tool to reduce risk and improve portfolio diversification.
Here’s why it matters.
1/
If used correctly, it can be a powerful tool to reduce risk and improve portfolio diversification.
Here’s why it matters.
1/
First, let’s define what correlation is.
Correlation is a statistic that measures the relationship between two assets.
It is represented by a coefficient that ranges between -1 and +1 which tells you how likely it is that the price of two assets will move together.
Correlation is a statistic that measures the relationship between two assets.
It is represented by a coefficient that ranges between -1 and +1 which tells you how likely it is that the price of two assets will move together.
If 2 assets have a correlation of 1, this means that they move in the same direction 100% of the time.
A correlation of -1 means that the 2 assets move in opposite directions.
While a correlation of 0 means the 2 assets have no relationship with one another.
A correlation of -1 means that the 2 assets move in opposite directions.
While a correlation of 0 means the 2 assets have no relationship with one another.

Why does this matter for my portfolio?
A highly correlated portfolio is a riskier portfolio. It means that when one of your tokens falls, it’s likely that all of them will also fall.
On the contrary, if your tokens are going up, then a highly correlated portfolio feels great.
A highly correlated portfolio is a riskier portfolio. It means that when one of your tokens falls, it’s likely that all of them will also fall.
On the contrary, if your tokens are going up, then a highly correlated portfolio feels great.
And while risk can never be eliminated, you can build a portfolio using a mix of assets that are less correlated, uncorrelated, or even negatively correlated to reduce the risk and minimize potential losses.
A correlation matrix is the easiest way to visualize the correlation coefficients of a group of assets.
It is simply a table where each cell shows the correlation between two different assets.
For example, over the past 30 days, the correlation between $UNI and $BNB is .45.
It is simply a table where each cell shows the correlation between two different assets.
For example, over the past 30 days, the correlation between $UNI and $BNB is .45.

With this in mind, let’s take a look at the correlation matrices of different sectors.
Top Assets
Correlation among most of the top assets remains high.
The only exception is $DOGE which is the only asset with negative correlations to the rest of the group.
Top Assets
Correlation among most of the top assets remains high.
The only exception is $DOGE which is the only asset with negative correlations to the rest of the group.

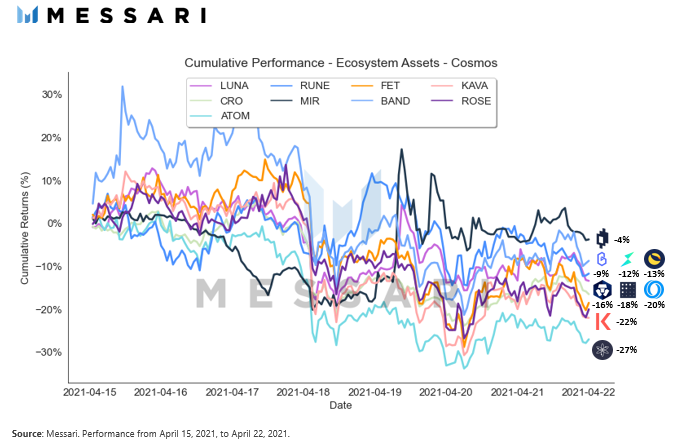
DeFi
Correlations in DeFi range from a low of -20% to a high of 84%. One exception is $LUNA which has become increasingly uncorrelated with the rest of the assets in the group week-over-week.
Correlations in DeFi range from a low of -20% to a high of 84%. One exception is $LUNA which has become increasingly uncorrelated with the rest of the assets in the group week-over-week.

Currencies
Unsurprisingly, correlations among currencies are concentrated on the high end of the correlation spectrum.
$DOGE is the exception, which has become slightly more uncorrelated with the rest of the assets in the group.
Unsurprisingly, correlations among currencies are concentrated on the high end of the correlation spectrum.
$DOGE is the exception, which has become slightly more uncorrelated with the rest of the assets in the group.

Smart Contract Platforms
Correlation among smart contract platforms tends to be on the positive side.
$SOL is the only exception becoming increasingly uncorrelated with values as low as -45%
Correlation among smart contract platforms tends to be on the positive side.
$SOL is the only exception becoming increasingly uncorrelated with values as low as -45%

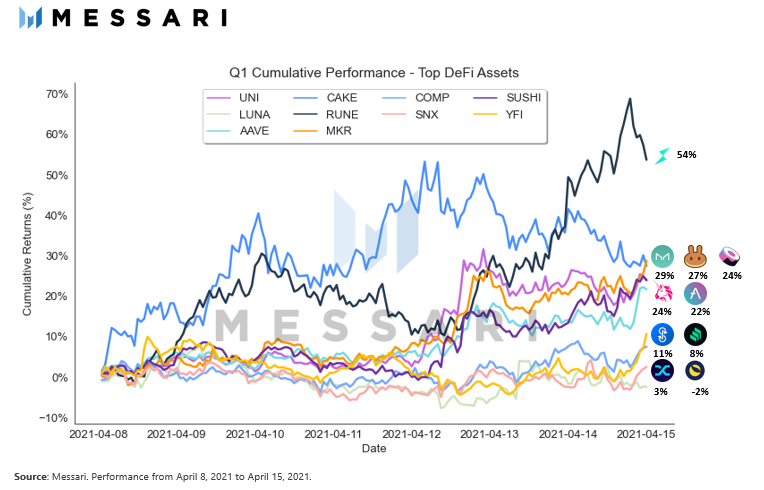
Decentralized Exchanges
Correlations within the group aren’t concentrated on either side of the spectrum.
$UNI, $CAKE, $RUNE have seen some decline in their correlation over the past week relative to the other assets in the sector.
Correlations within the group aren’t concentrated on either side of the spectrum.
$UNI, $CAKE, $RUNE have seen some decline in their correlation over the past week relative to the other assets in the sector.

Web-3
Week-over-week correlations among Web-3 have mostly remained stable.
The two to note are $STX and $AR which are becoming increasingly uncorrelated with the rest of the group.
Week-over-week correlations among Web-3 have mostly remained stable.
The two to note are $STX and $AR which are becoming increasingly uncorrelated with the rest of the group.

• • •
Missing some Tweet in this thread? You can try to
force a refresh