The spark for the protest by Manchester United fans at Old Trafford might have been the deeply unpopular Super League, but it also highlighted an underlying unhappiness with the club’s owners, so I thought it might be interesting to look at the finances under the Glazers #MUFC
The Glazers took control of #MUFC back in June 2005 via a £550m leveraged buyout, so their first full season in control was 2005/06. Therefore, this review will look at the 15 seasons since then, up to 2019/20.
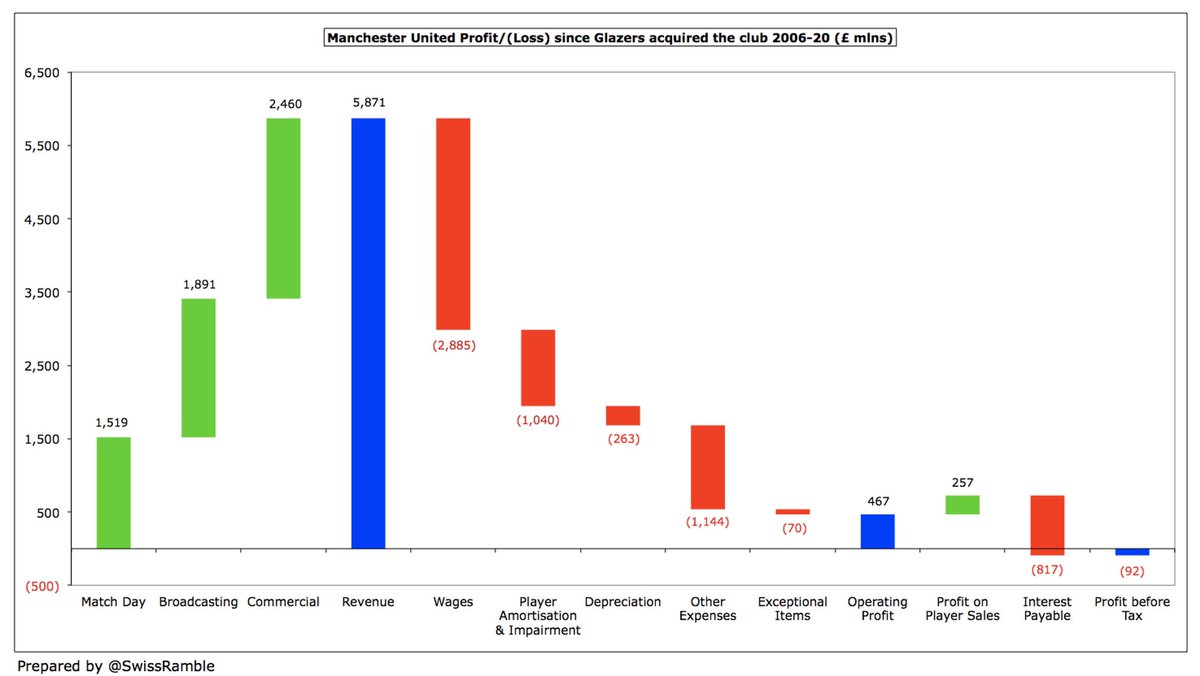
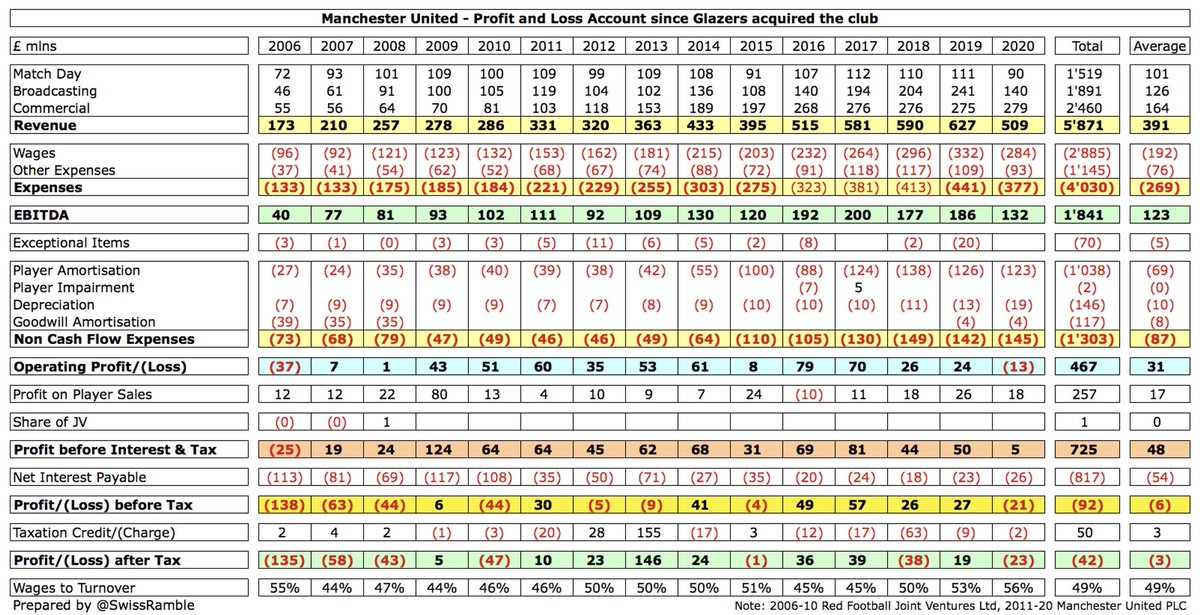
In the last 15 years #MUFC have generated an impressive £5.9 bln revenue, but had £5.4 bln expenses (including £2.9 bln wages and £1 bln player amortisation), leading to £467m operating profit. This was boosted by £257m profit on player sales, but £817m interest meant £92m loss. 
Many fans are now familiar with the profit and loss account, but we need to explore the cash flow statement to fully understand how #MUFC have fared under the Glazers – and just how much money they have taken out of the club.
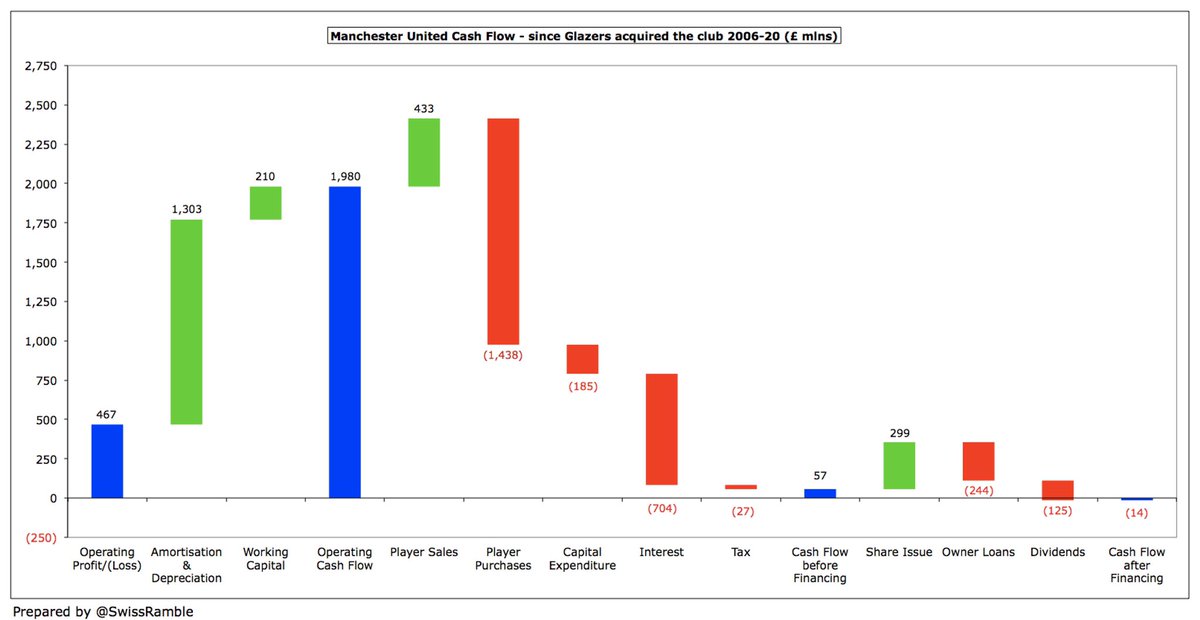
#MUFC operating profit of £467m was improved to £2.0 bln operating cash flow via two adjustments: (a) adding back non-cash items such as player amortisation, depreciation and impairment £1.3 bln; (b) movements in working capital £210m.
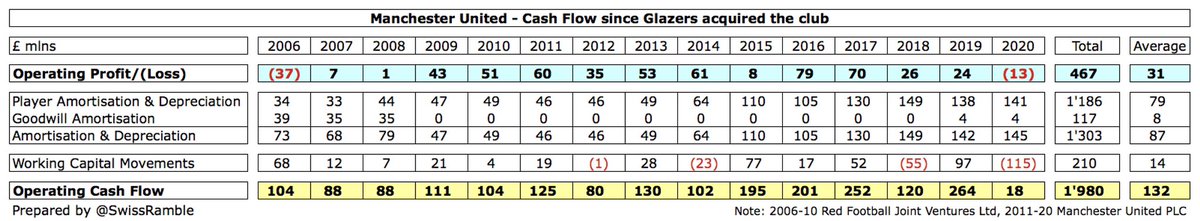
Player amortisation is a non-cash expense, so is added back for the cash flow calculation. In the same way, profit on player sales is purely an accounting profit, which is booked in total, regardless of when the club is paid. Instead, cash flow includes cash sales & purchases.
Working capital measures short-term liquidity, defined as current assets less current liabilities. Changes in working capital can cause operating cash flow to differ from net profit, as clubs book revenue and expenses when they occur instead of when cash actually changes hands.
If current liabilities increase, a club is paying its suppliers more slowly, so is holding on to cash (positive for cash flow). On the other hand, if a club’s debtors increase, this means it collected less money from customers than it recorded as revenue (negative for cash flow).
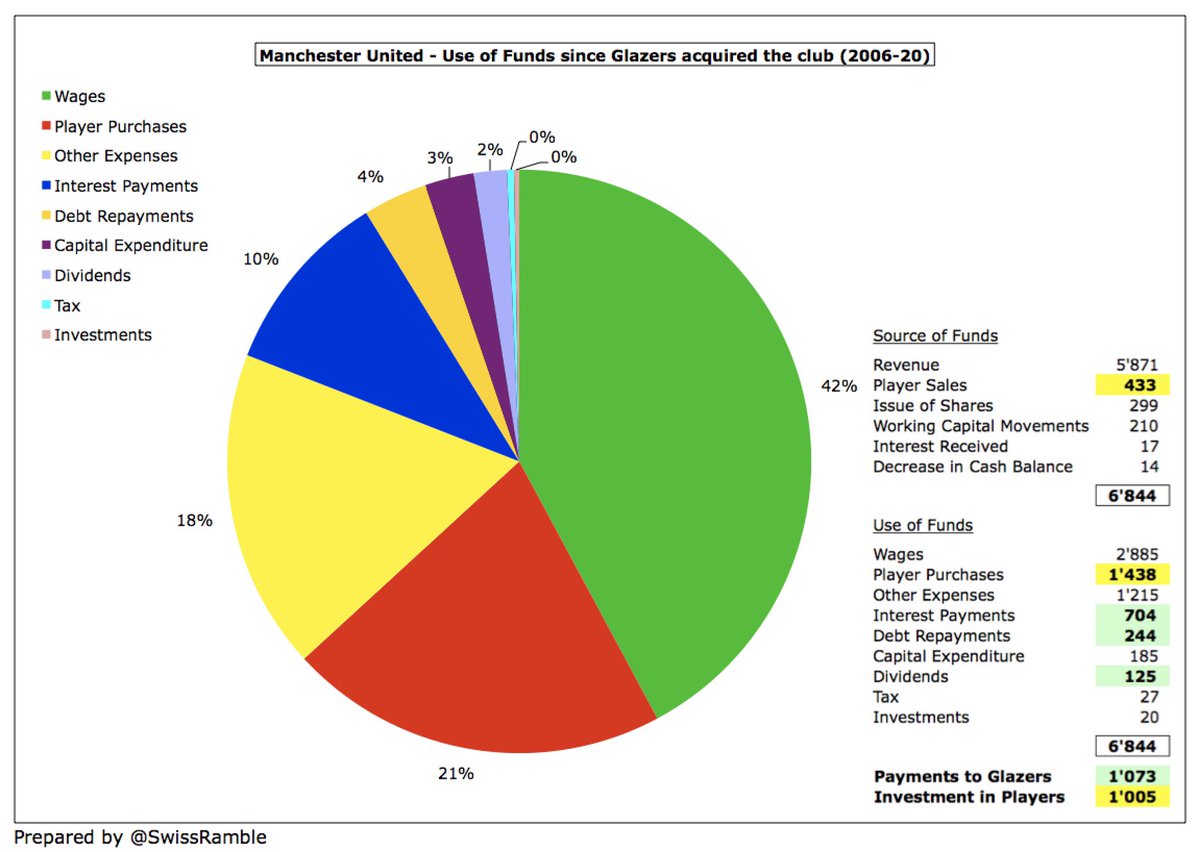
#MUFC had £1.0 bln net spend on players (purchases £1.4 bln, £0.4 bln sales), but spent almost as much (£704m) on interest on the loans taken out by the Glazers. Only £185m was spent on infrastructure (stadium and training ground). Cash flow before financing was therefore £57m.
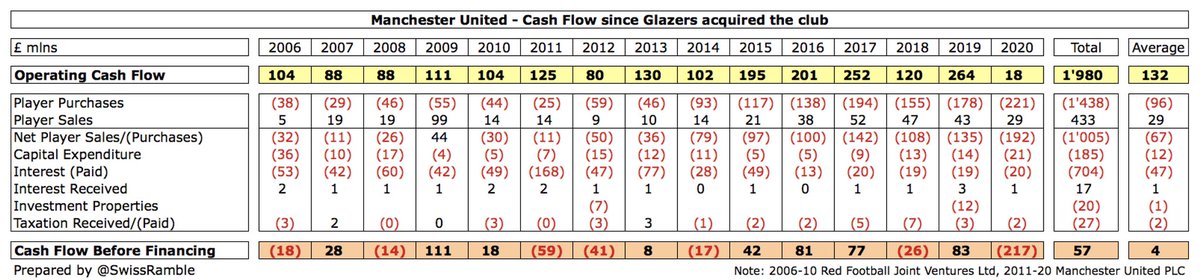
#MUFC also spent £244m on loan repayments and £125m on dividends, partly financed by £299m from various share issues (net of subsidiary acquisition). As a result, the club ended up with a £14m net cash outflow.
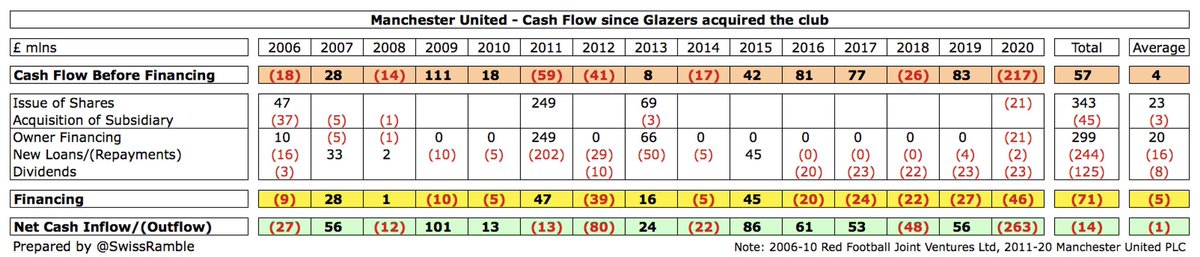
#MUFC fans will be painfully aware that their club has paid huge sums for the privilege of having the Glazers as owners. Since the leveraged buy-out they have spent £1.1 bln on financing: £704m interest, £244m debt repayments and £125m dividends. Averaged £42m in last 5 years.
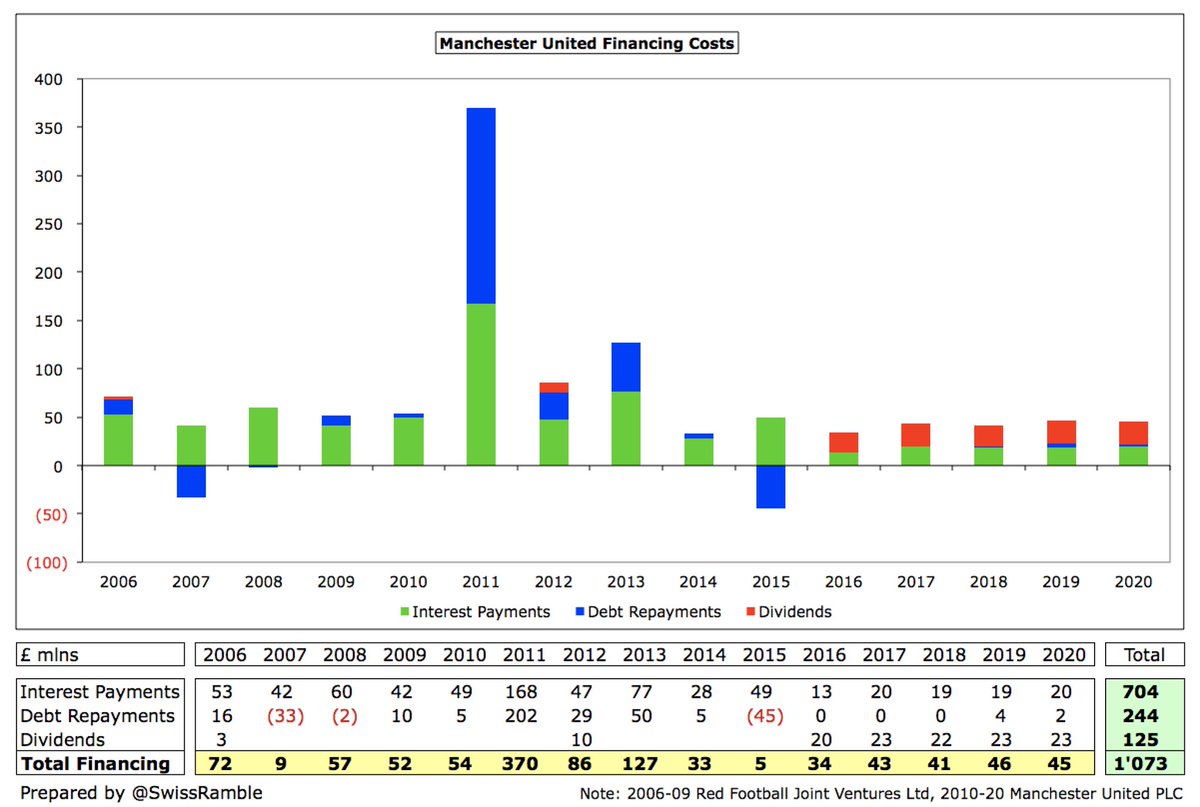
The £1.1 bln cost of financing the Glazers’ ownership is “only” 16% of #MUFC £6.8 bln expenditure since June 2005, but it is a huge sum. It’s more than £1.0 bln spent (net) on players and could have been spent on improving the squad (or even the increasingly shabby Old Trafford).
Supporters of the Glazers will point to their commercial acumen, in the belief that #MUFC revenue growth has somehow justified the fact that the club has (to date) had to shell out over a billion quid to finance the takeover, but is this really the case?
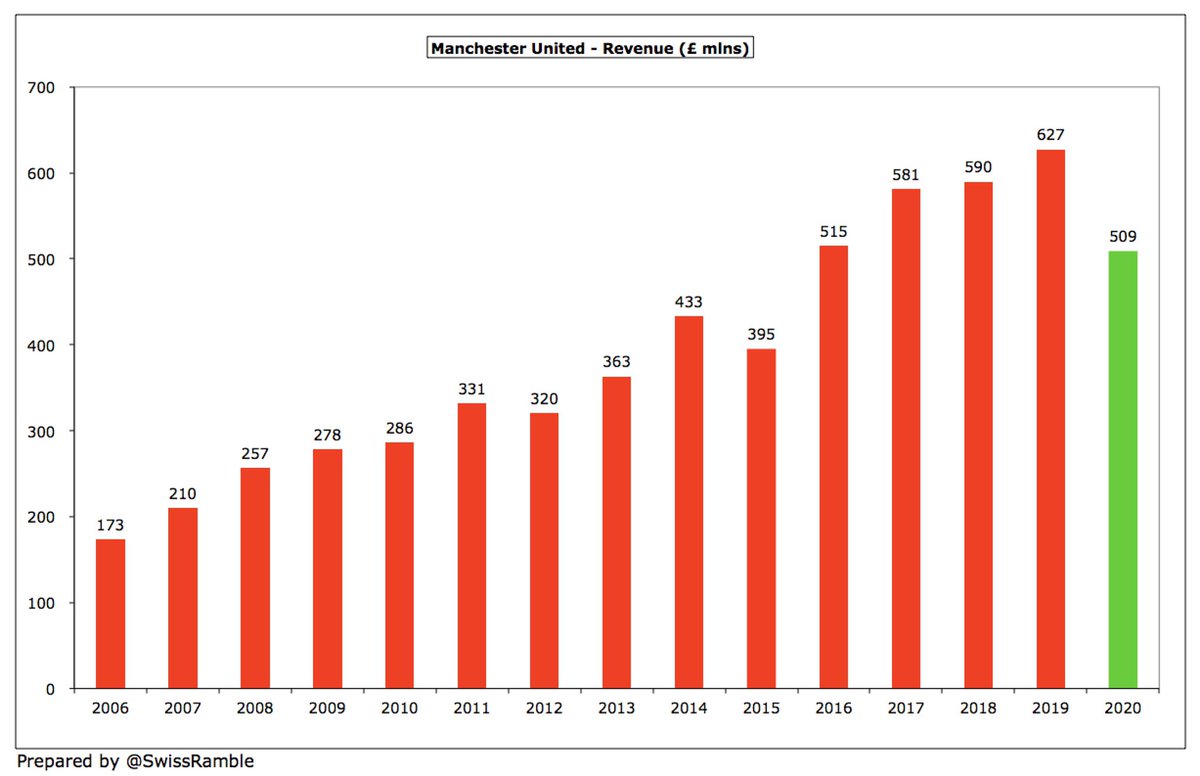
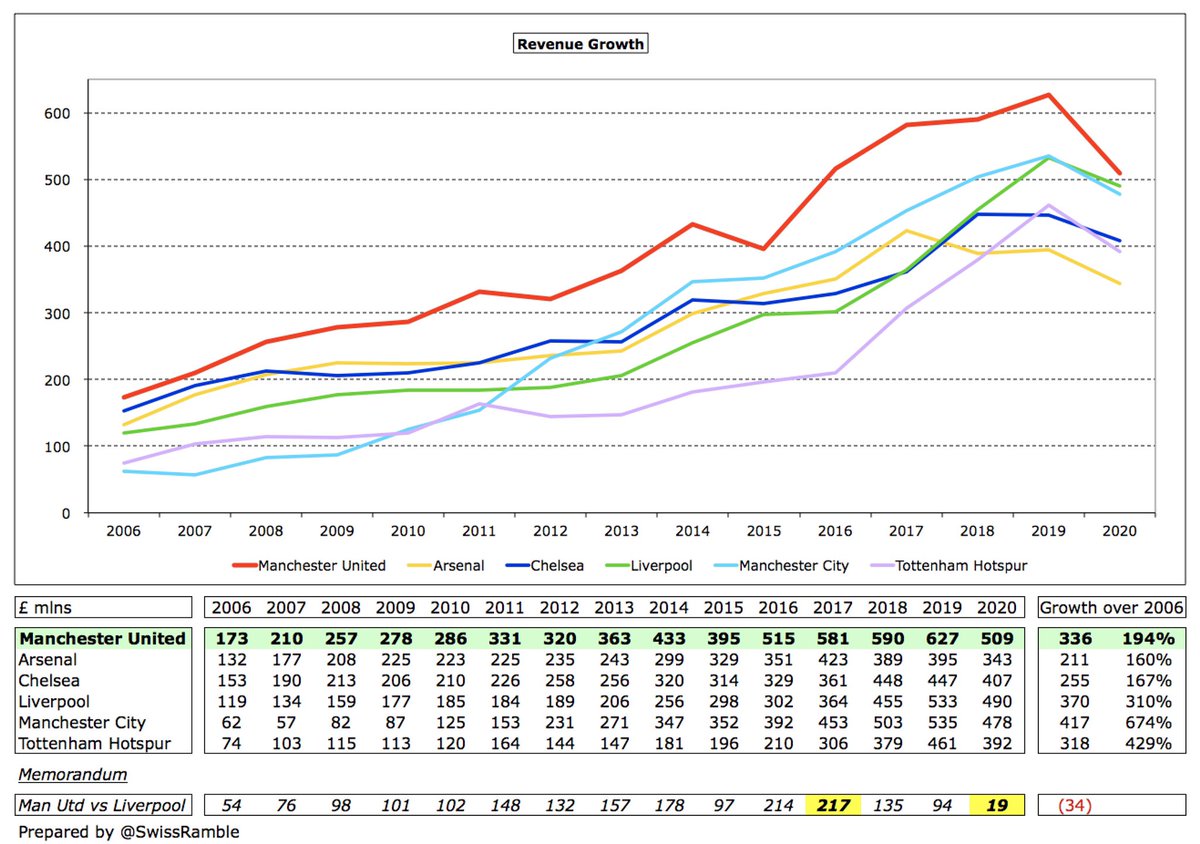
It is certainly true that #MUFC revenue has nearly tripled under the Glazers, rising by £336m from £173m to £509m, but it is worth noting that two clubs have outpaced them in this period, namely #MCFC and #LFC, who have grown by £417m and £370m respectively.
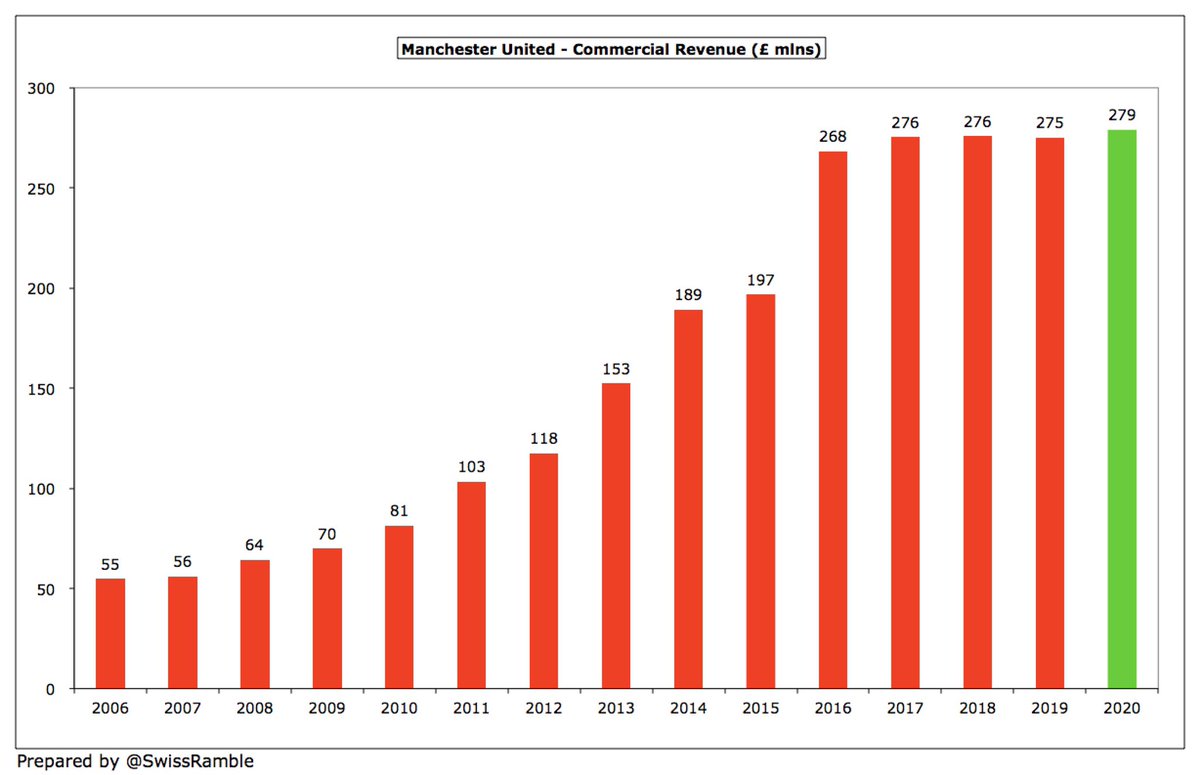
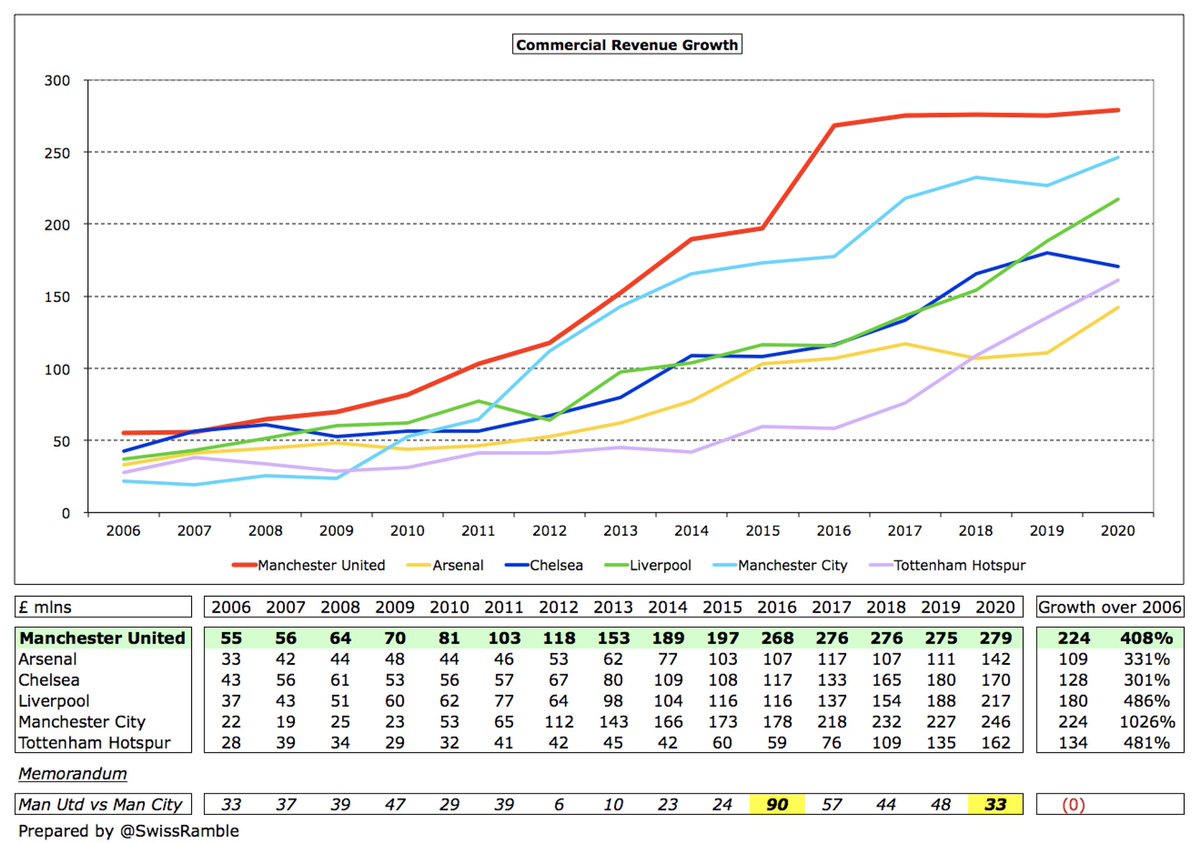
Of course, commercial has been the engine for #MUFC growth, rising £224m from £55m to £279m, but it is worth noting that there has been zero growth for the last 4 years (and the new TeamViewer deal is worth much less than Chevrolet). #MCFC increase since 2006 is exactly the same.
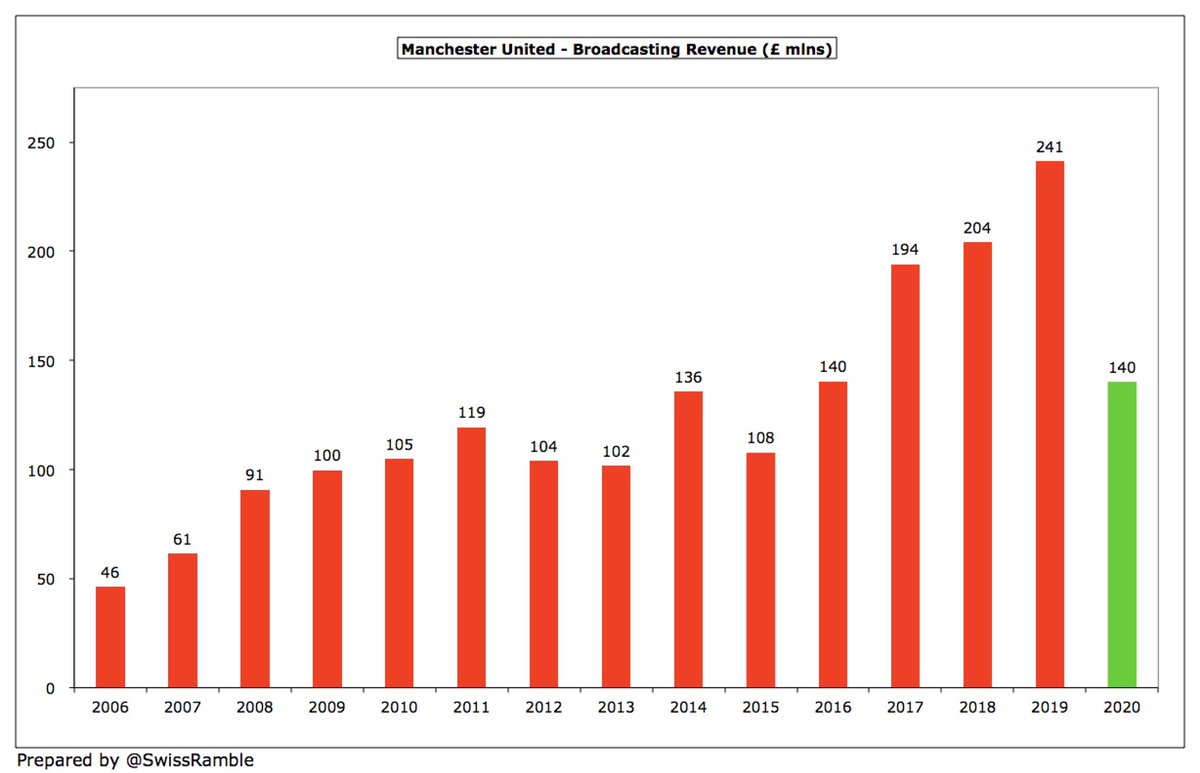
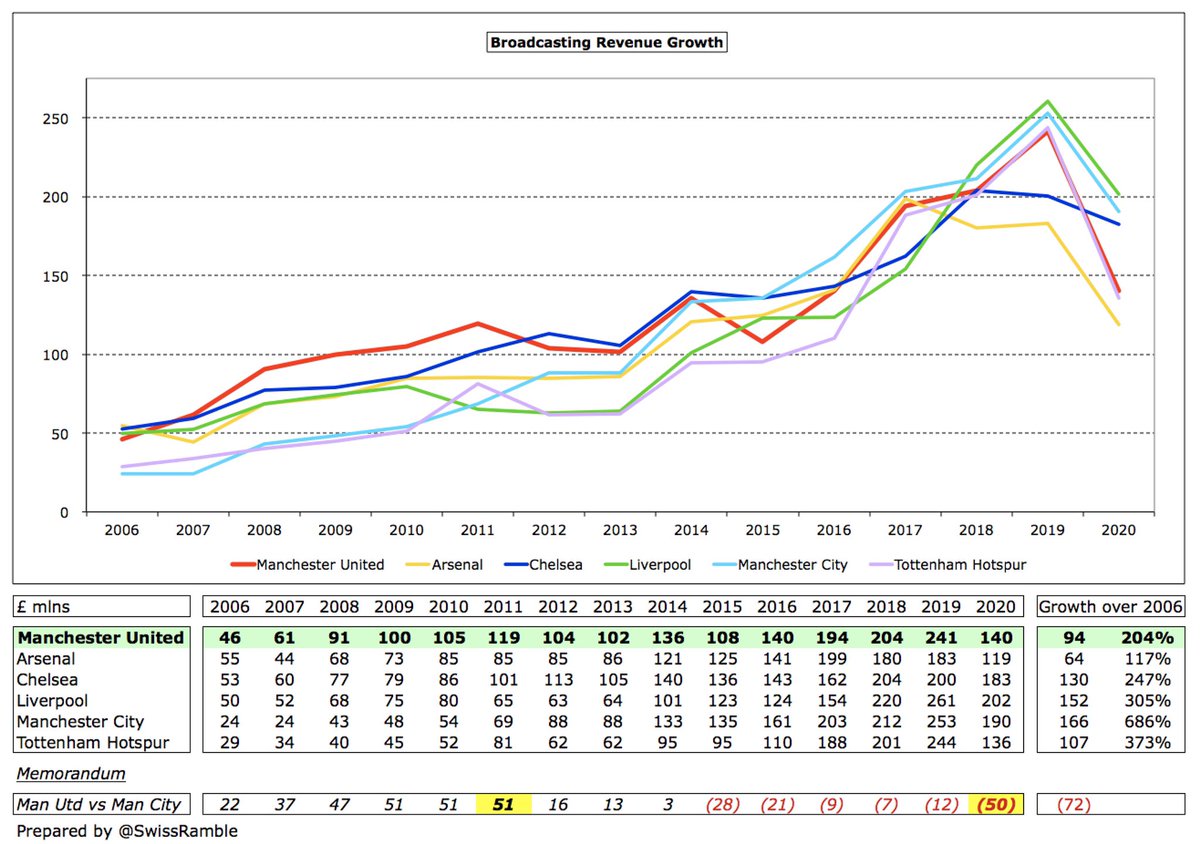
#MUFC broadcasting income has tripled from £46m to £140m, but the £94m growth is lower than #MCFC £166m, #LFC £152m, #CFC £130m and #THFC 107m, which reflects the lack of success on the pitch, most notably in Europe. All clubs heavily impacted by COVID in 2020.
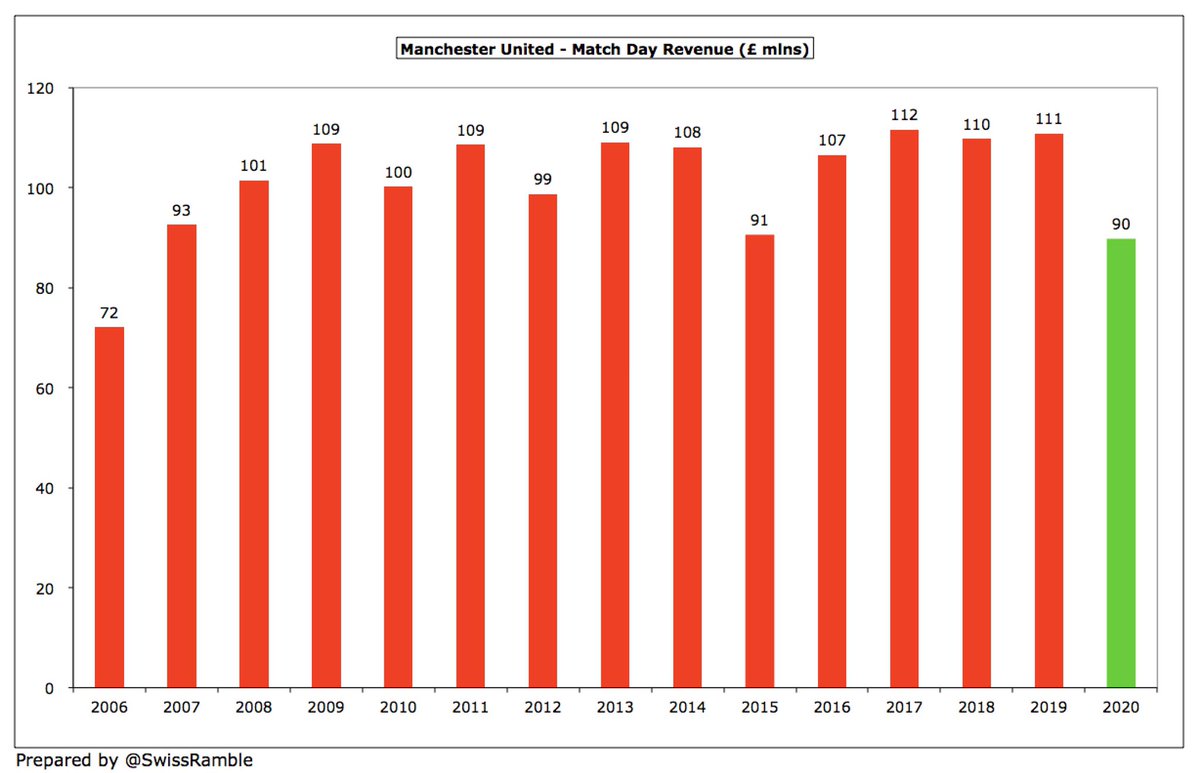
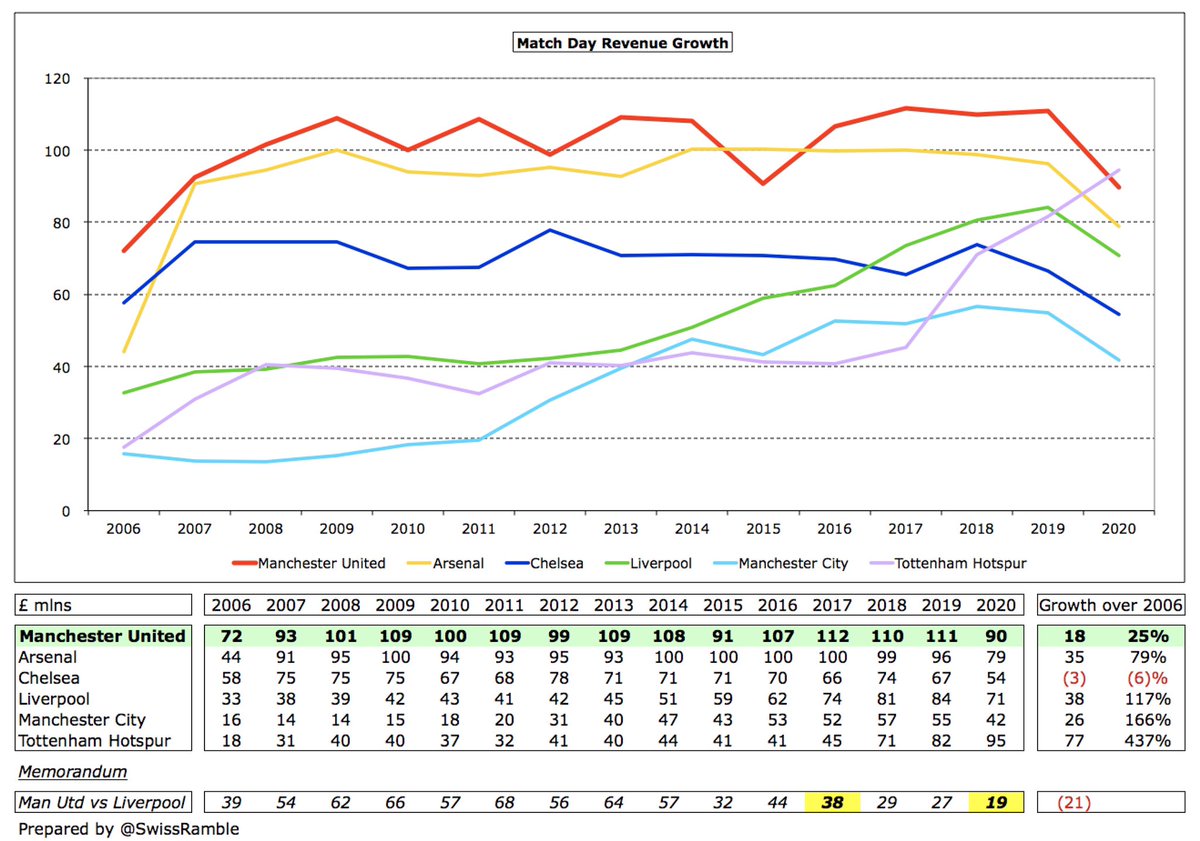
Similarly, the £18m increase in #MUFC match day revenue from £72m to £90m is less than the growth at four other members of the Big Six, as others have invested in stadium moves or expansion: #THFC £77m, #LFC £38m, #AFC £35m and #MCFC £26m. In fact, Spurs overtook United in 2020.
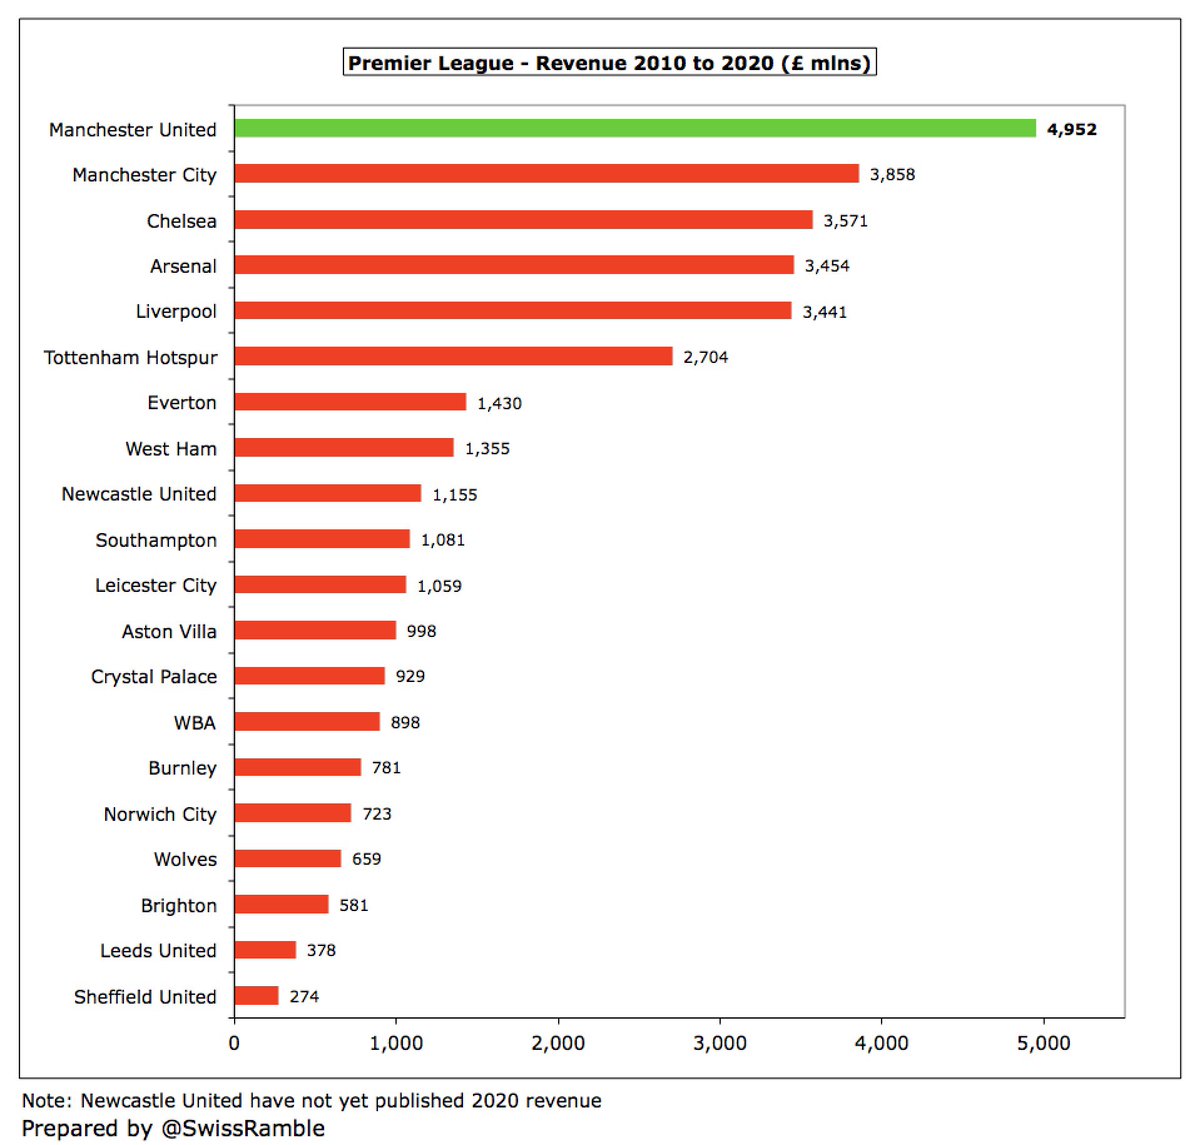
Nevertheless, #MUFC remain a financial powerhouse. They generated £5 bln revenue since 2010, which is by some distance the highest in the Premier League, a cool £1.1 bln ahead of #MCFC £3.9 bln, followed by #CFC £3.6 bln, #AFC £3.5 bln, #LFC £3.4 bln and #THFC £2.7 bln.
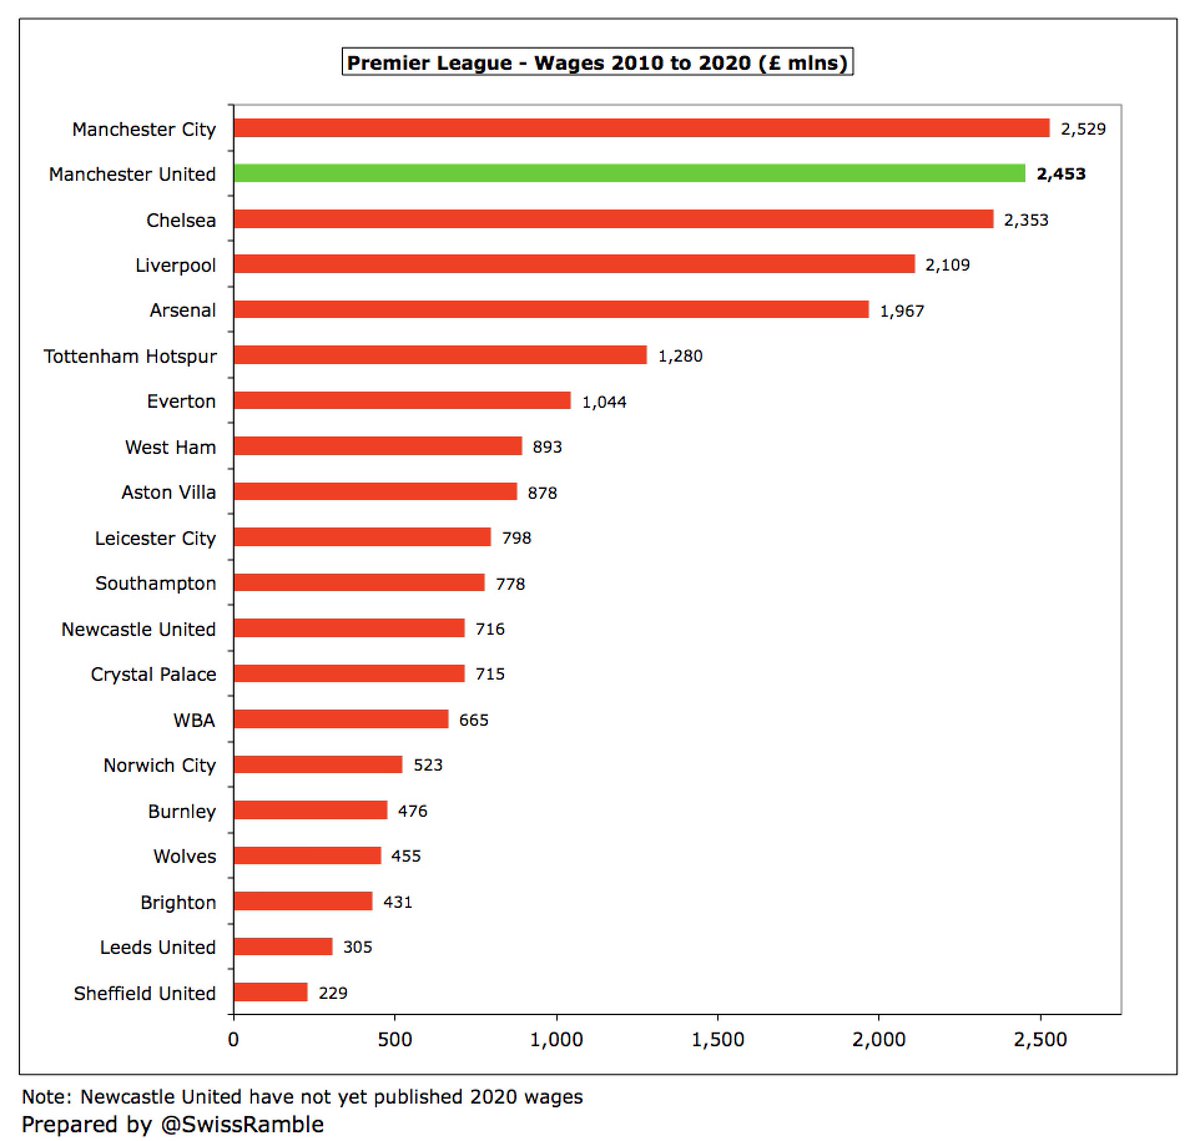
Despite having by far the highest revenue in this period, #MUFC £2.4 bln wage bill since 2010 was less than #MCFC £2.5 bln, though still ahead of #CFC £2.3 bln, #LFC £2.1 bln #AFC £2.0 bln and #THFC £1.3 bln. On this basis, the team should have performed better on the pitch.
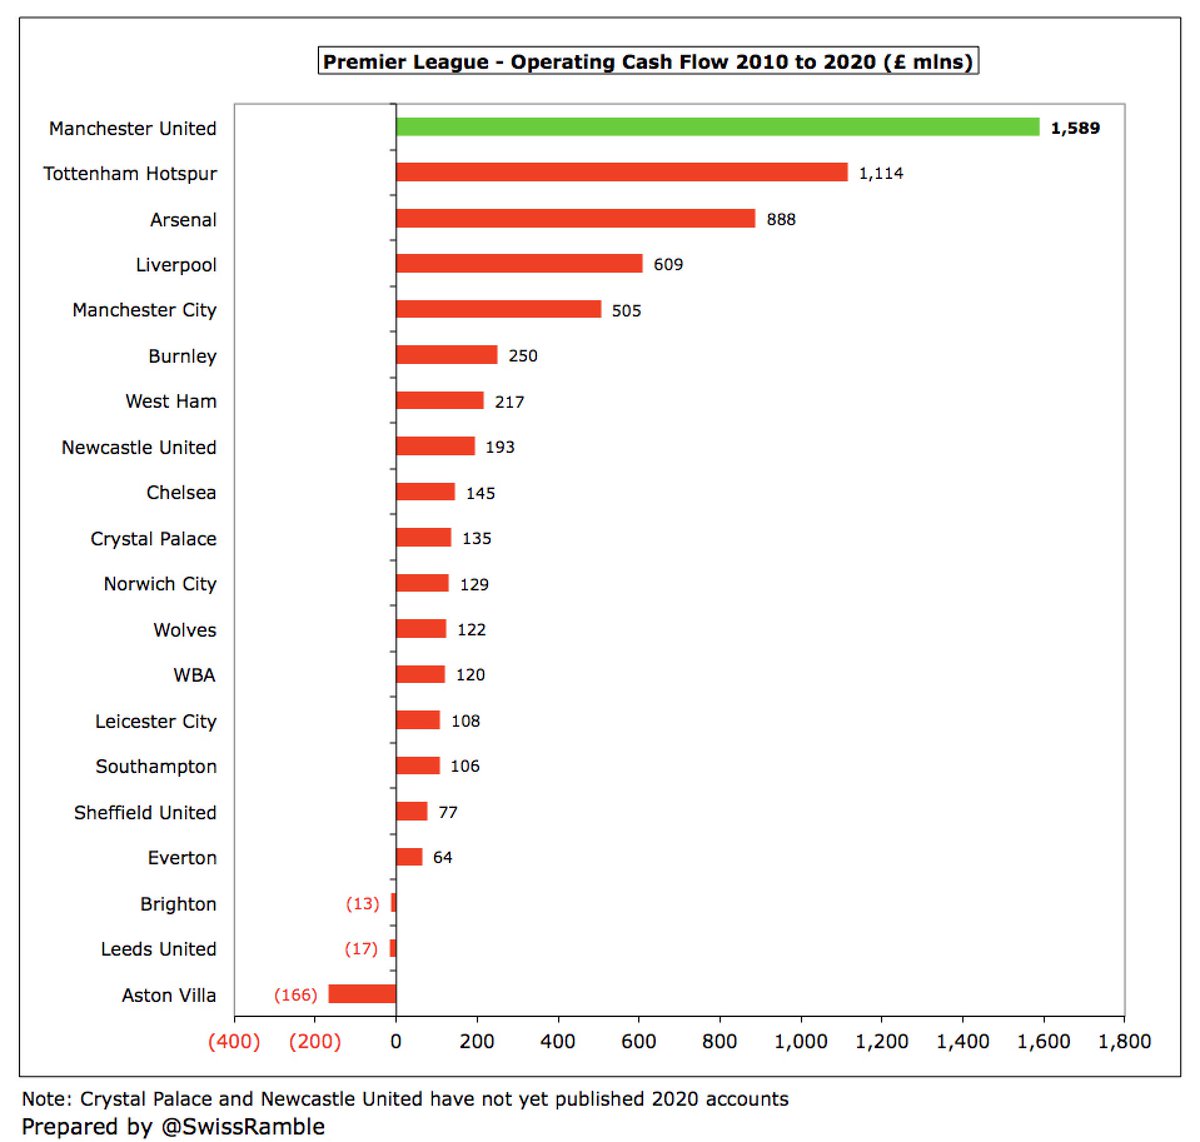
Off the pitch, #MUFC are a veritable cash machine, as their £1.6 bln operating cash flow is miles ahead of their rivals: #THFC £1.1 bln, #AFC £888m, #LFC £609m and #MCFC £505m. #CFC business model focuses more on player trading, so they are way back with £145m.
This £1.6 bln operating cash flow is what was available to #MUFC to spend on buying players or investing in infrastructure (stadium or training ground), though we shall see that a big chunk has actually gone on interest payments, loan repayments and dividends.
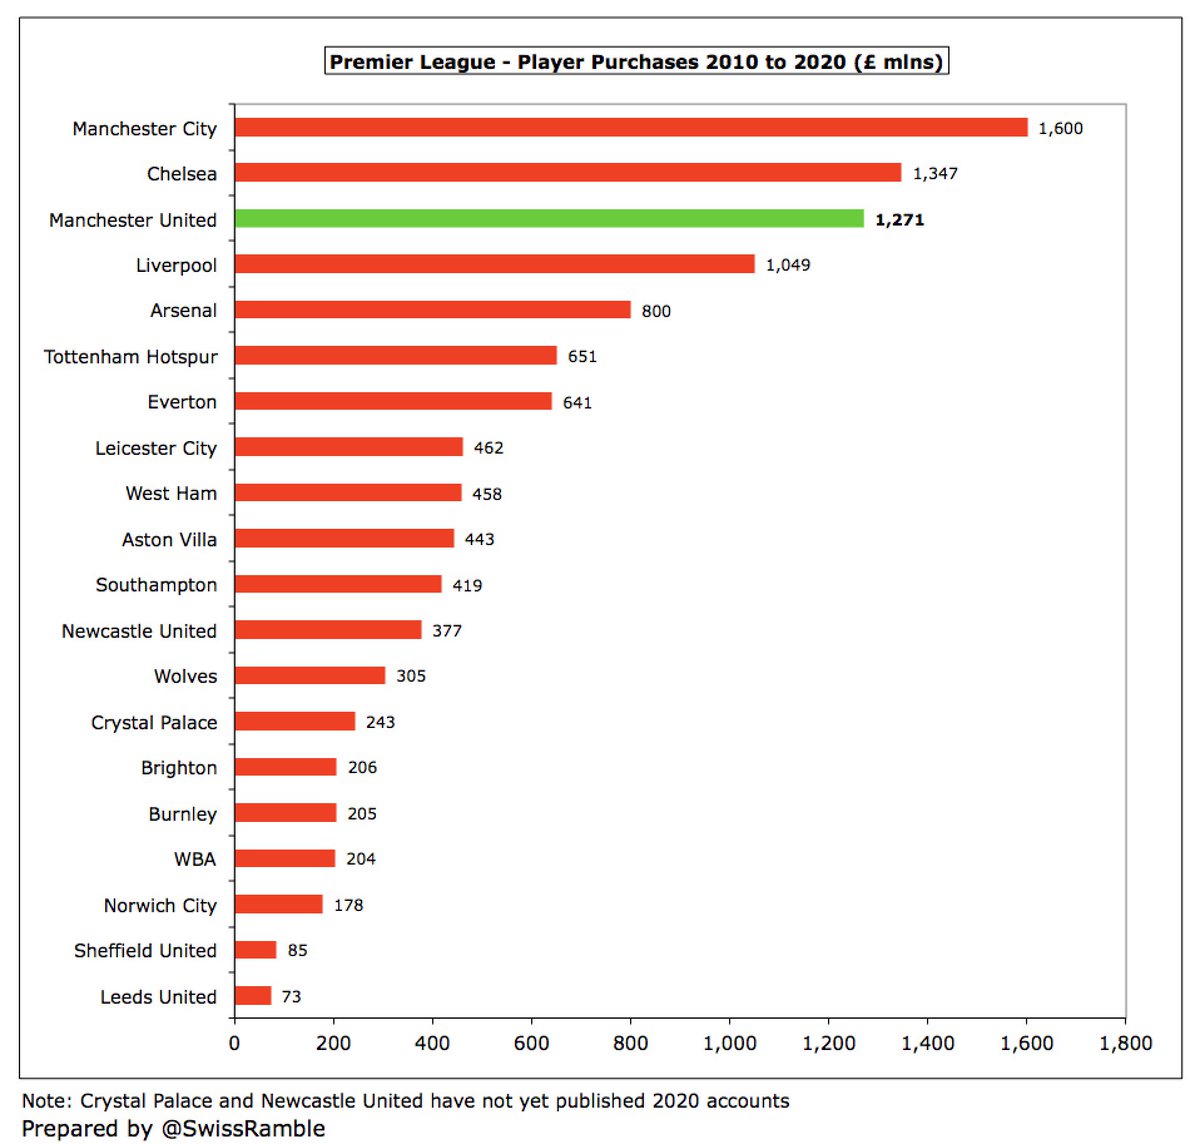
That said, #MUFC have splashed out a hefty £1.3 bln on player purchases since 2010. This was surpassed by #MCFC £1.6 bln and #CFC £1.3 bln, but was much more than the likes of #LFC £1.0 bln, #AFC £800m and #THFC £651m.
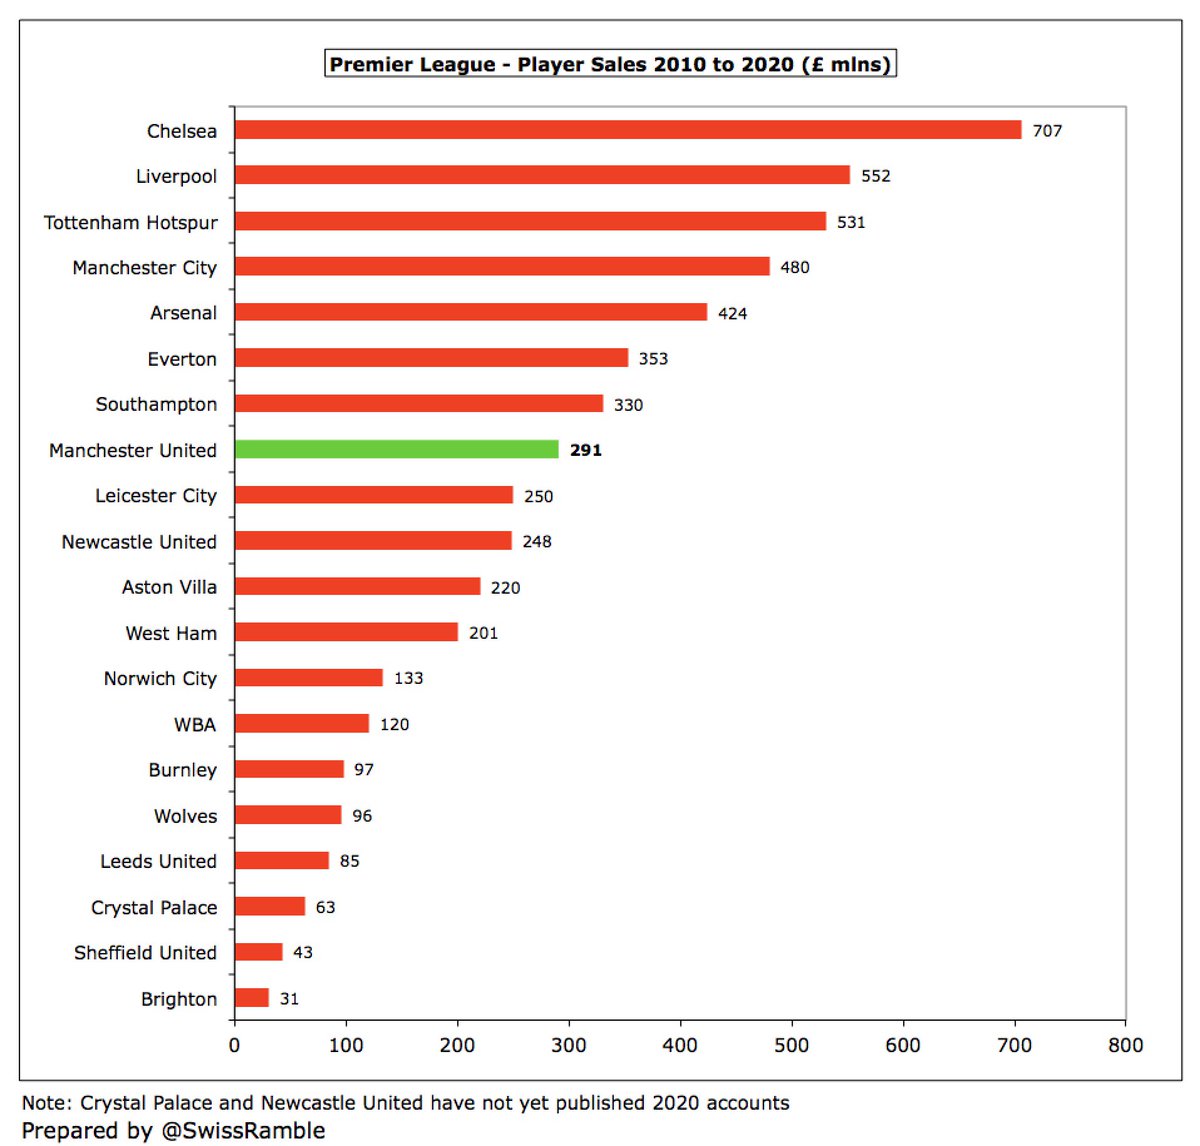
Many clubs make good money from player sales, but #MUFC have only delivered £291m from the activity in the last 11 years, significantly less than #CFC £707m and #LFC £552m. Not only is this lower than the rest of the Big Six, but also worse than #EFC and #SaintsFC.
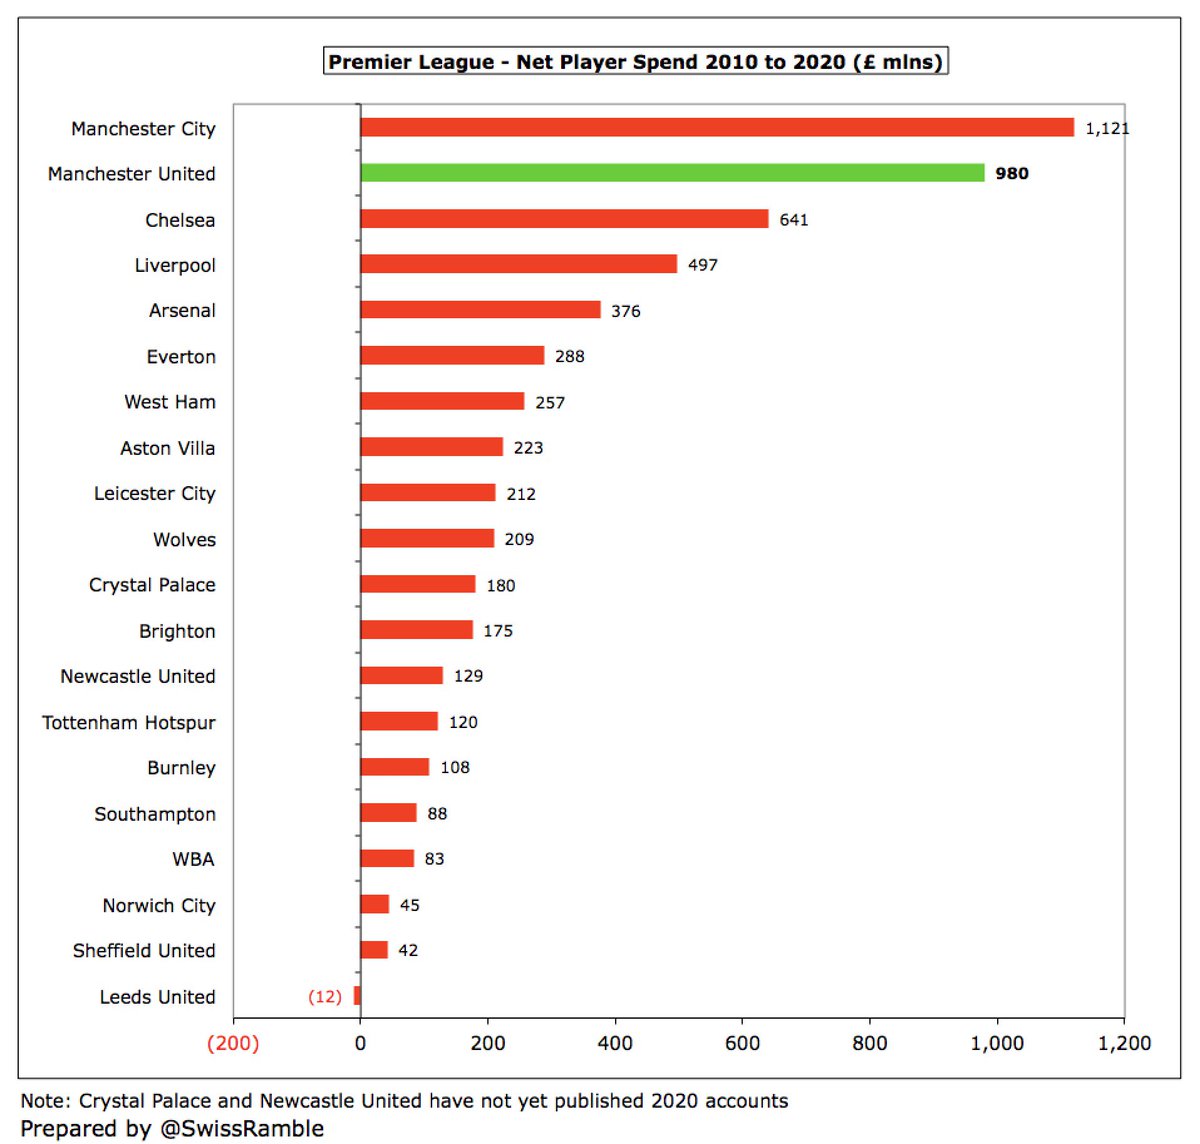
Consequently, #MUFC £1.0 bln net spend in the transfer market is second highest in the Premier League since 2010, only behind their neighbours #MCFC £1.1 bln, with a substantial gap to the third placed club #CFC £641m.
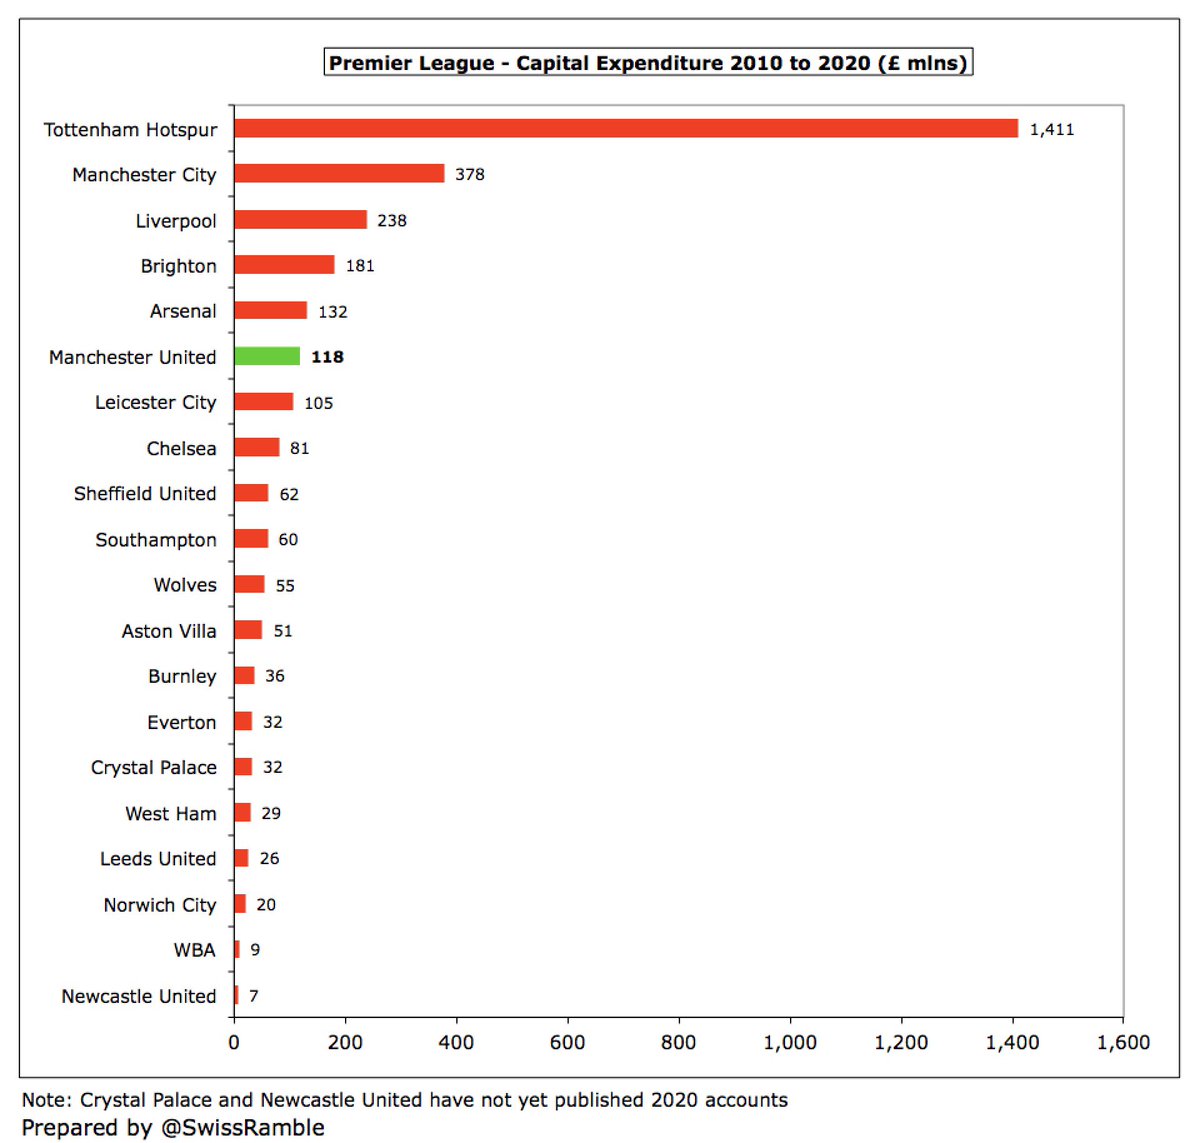
#MUFC have only spent £118m on infrastructure in the last 11 years. Obviously, this is dwarfed by #THFC £1.4 bln (new stadium and training ground), but it is also lower than #MCFC £378m, #LFC £238m, #BHAFC £181m and #AFC £132m, where owners have invested in the future.
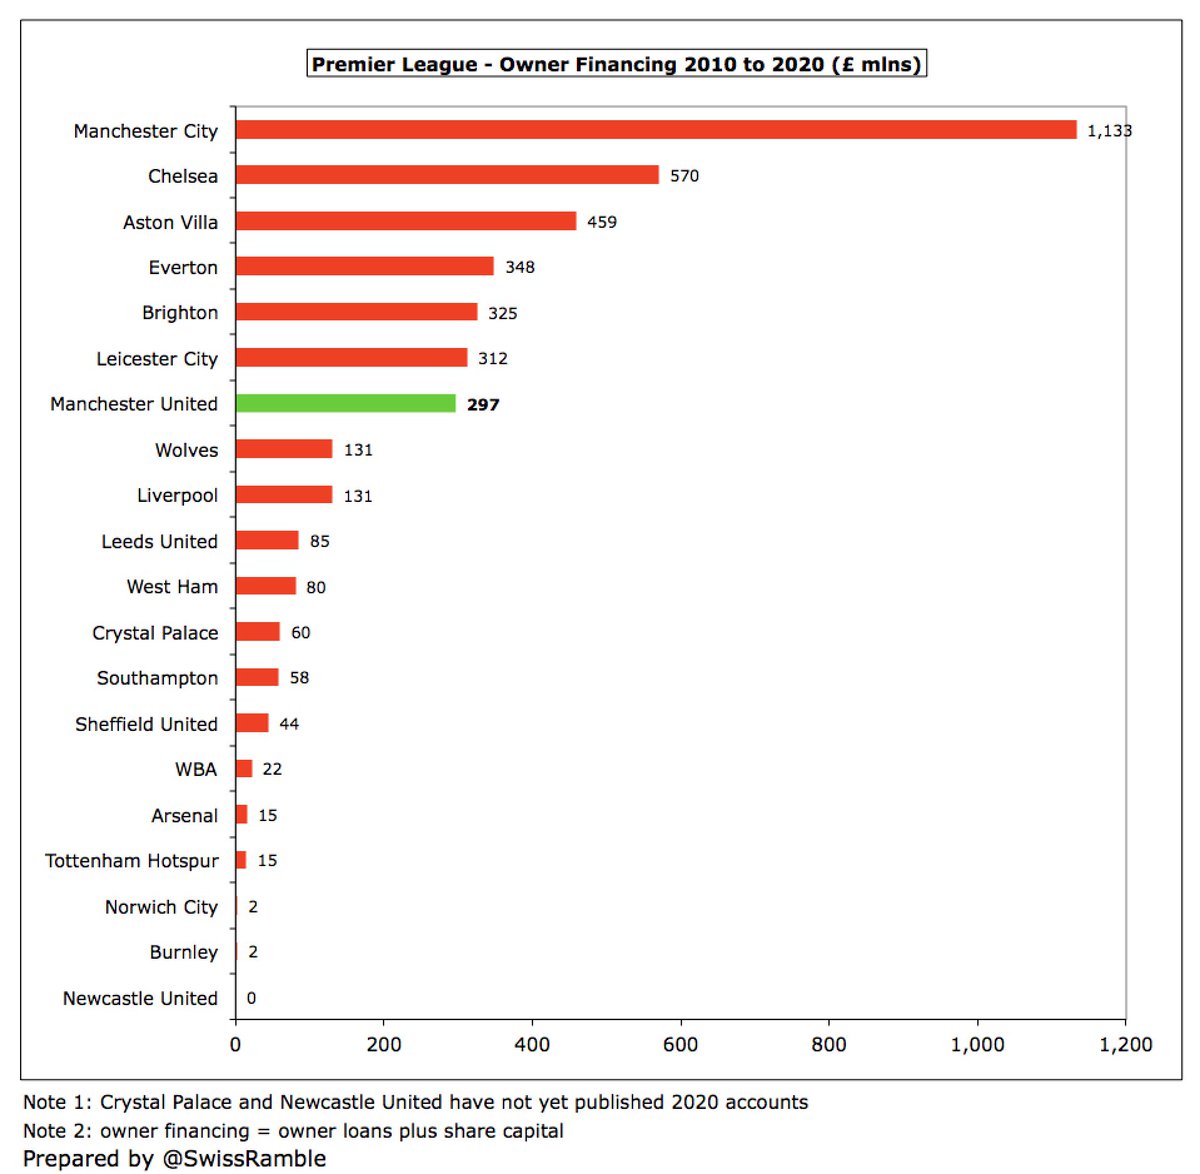
It will be no surprise to see that owners at #MCFC and #CFC have provided substantial financing, £1.1 bln and £570m respectively since 2010, but #MUFC £297m is also behind #AVFC, #EFC, #BHAFC & #LCFC. Also United’s money is from share issues, so it’s not really from the Glazers.
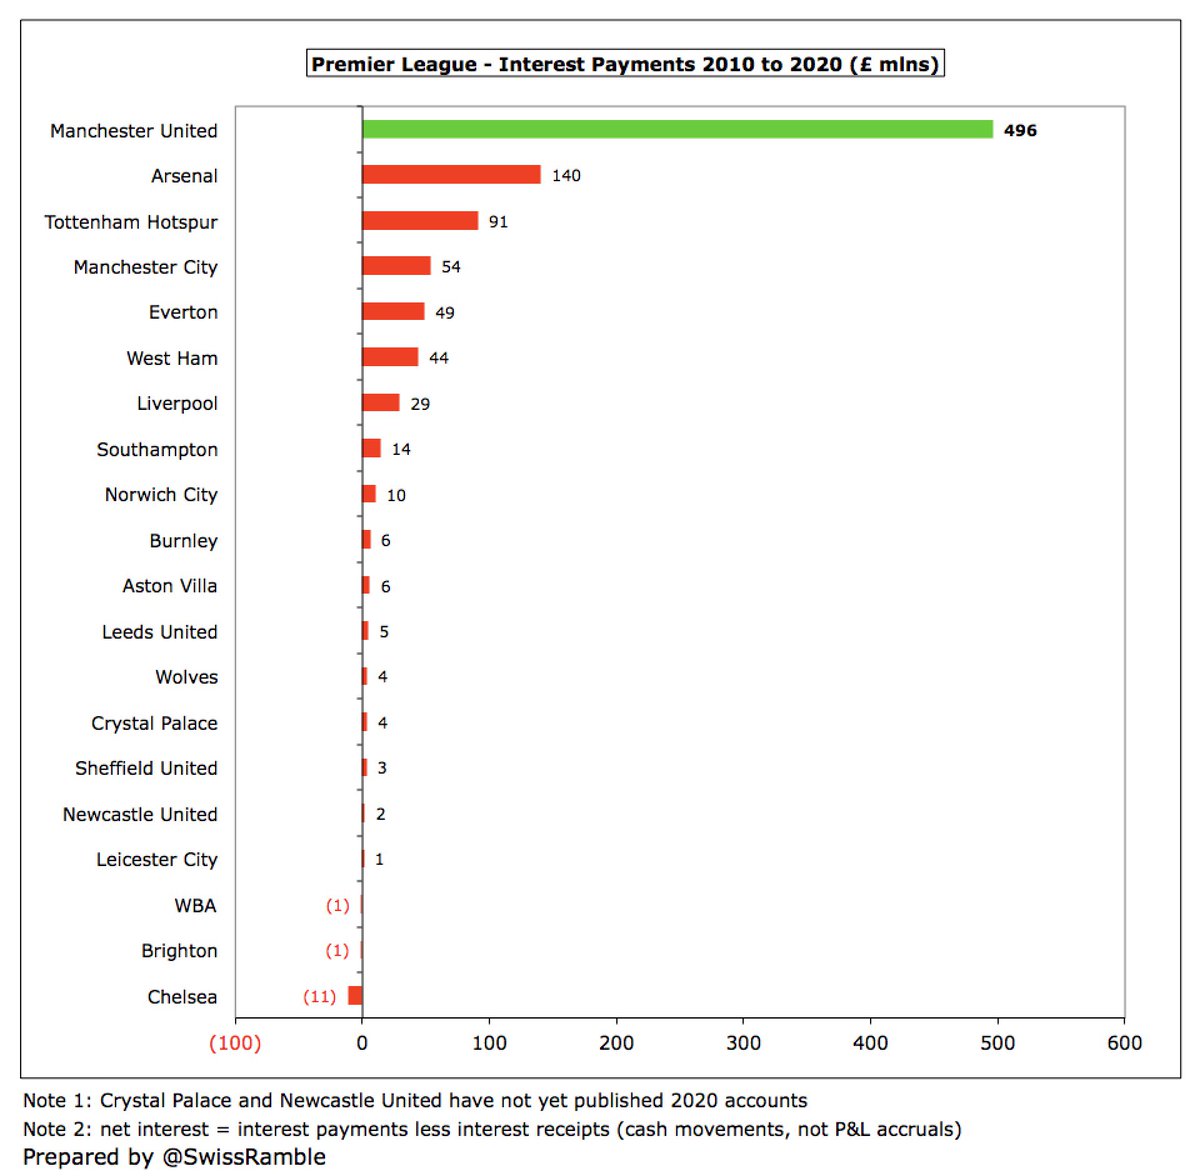
Where #MUFC are in a league of their own is interest payments, which add up to a staggering half a billion pounds since 2010, which is more than all the other Premier League clubs combined. The next highest is #AFC, whose £140m pales into insignificance compared to United.
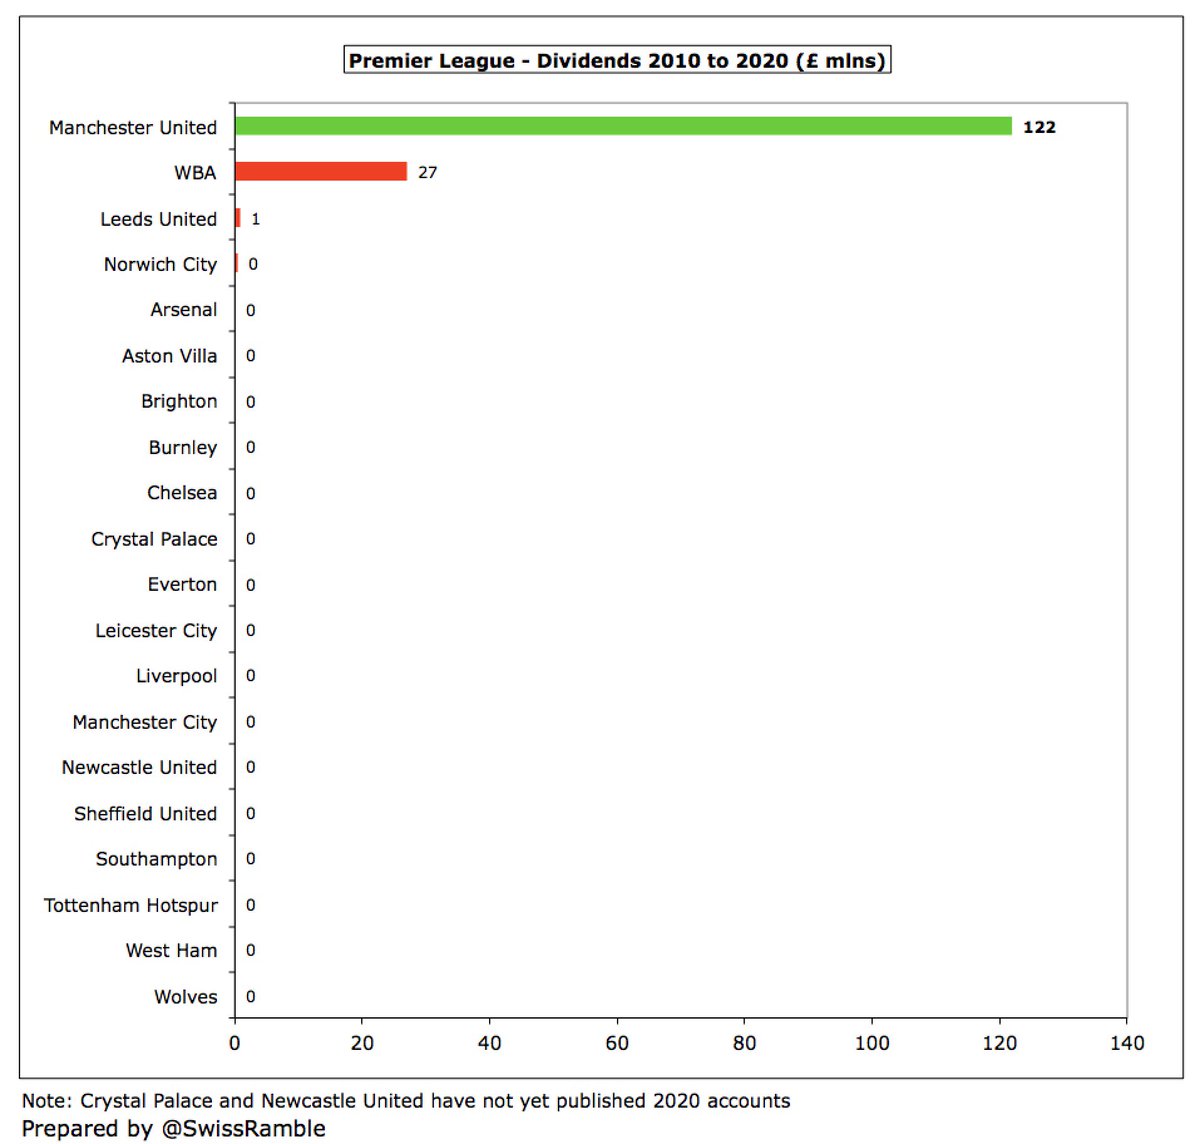
If you think that the interest payments are bad, wait until you look at the dividends. #MUFC £122m (around £23m a year in 2020) is again by far the highest. In fact, they are the only Premier League club currently paying dividends, as #WBA and #LUFC were once-off payments.
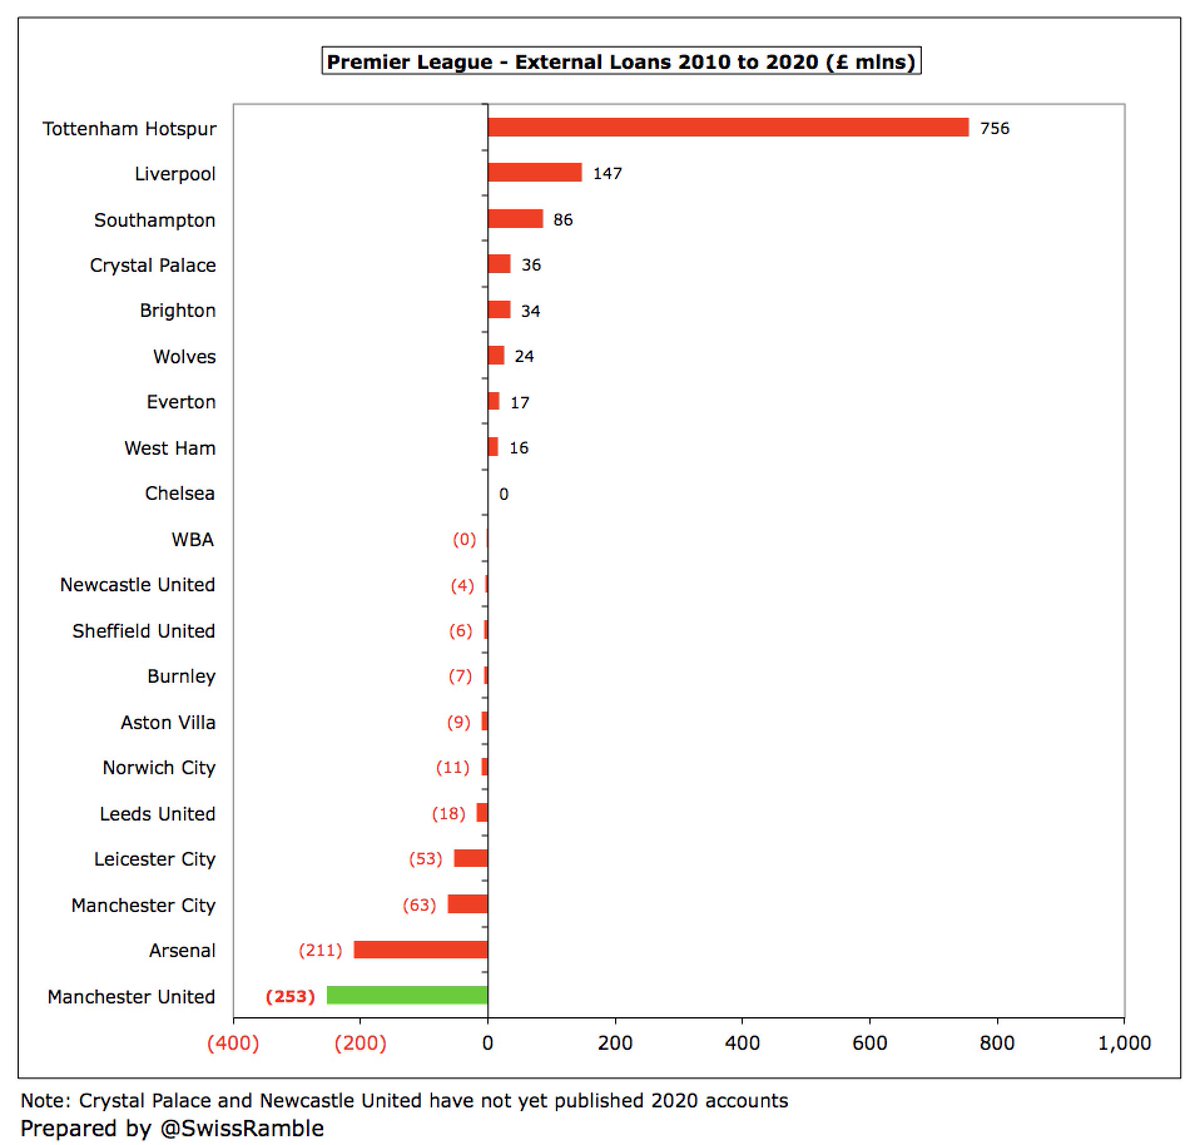
If that’s not enough, #MUFC have also had to pay another quarter of a billion pounds on loan repayments since 2010, again the highest in the Premier League, ahead of #AFC £211m (and the Gunners have new stadium to show for it). #THFC £756m is mainly to fund their new ground.
You would hope that after the loan repayments #MUFC debt would have reduced, but it has remained around £500m for the last few years. It did come down from a peak of £773m in 2010 after PIK loans (16.25% interest rate) were repaid, but the club had no debt before the Glazers.
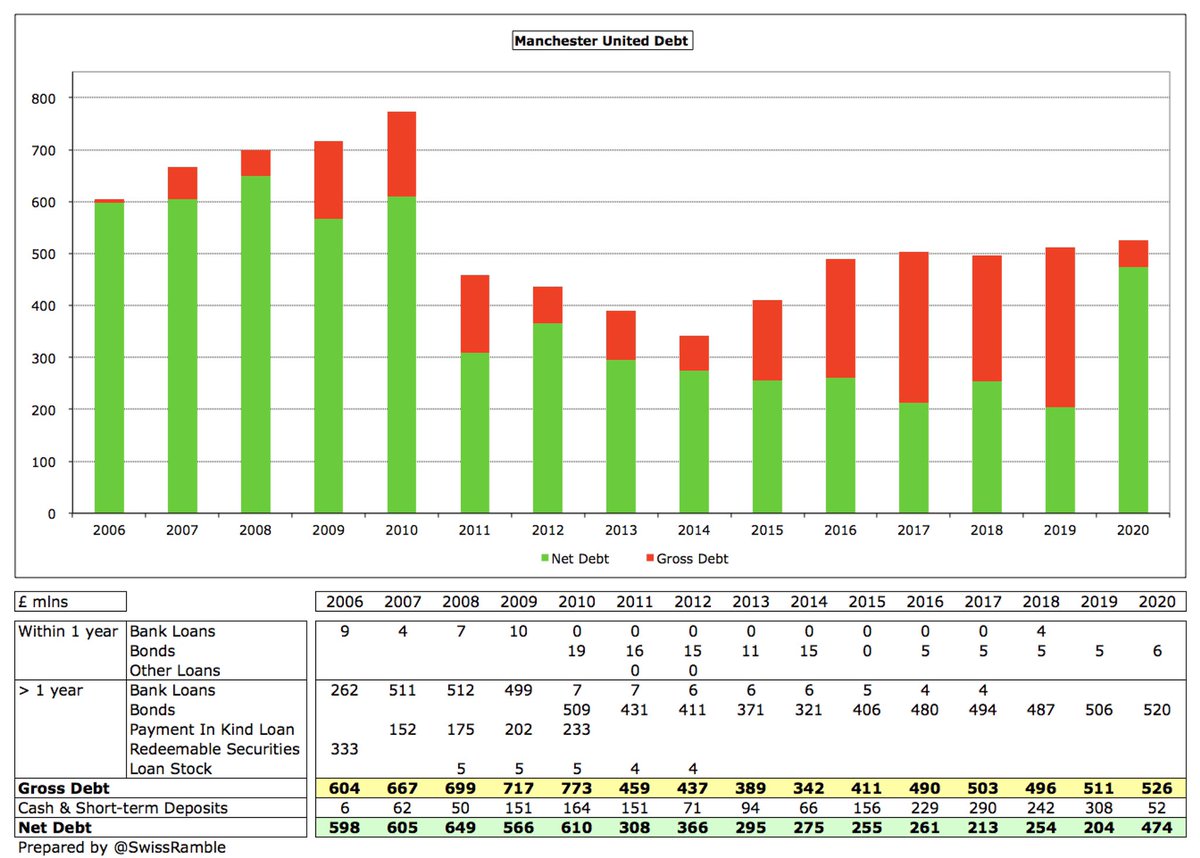
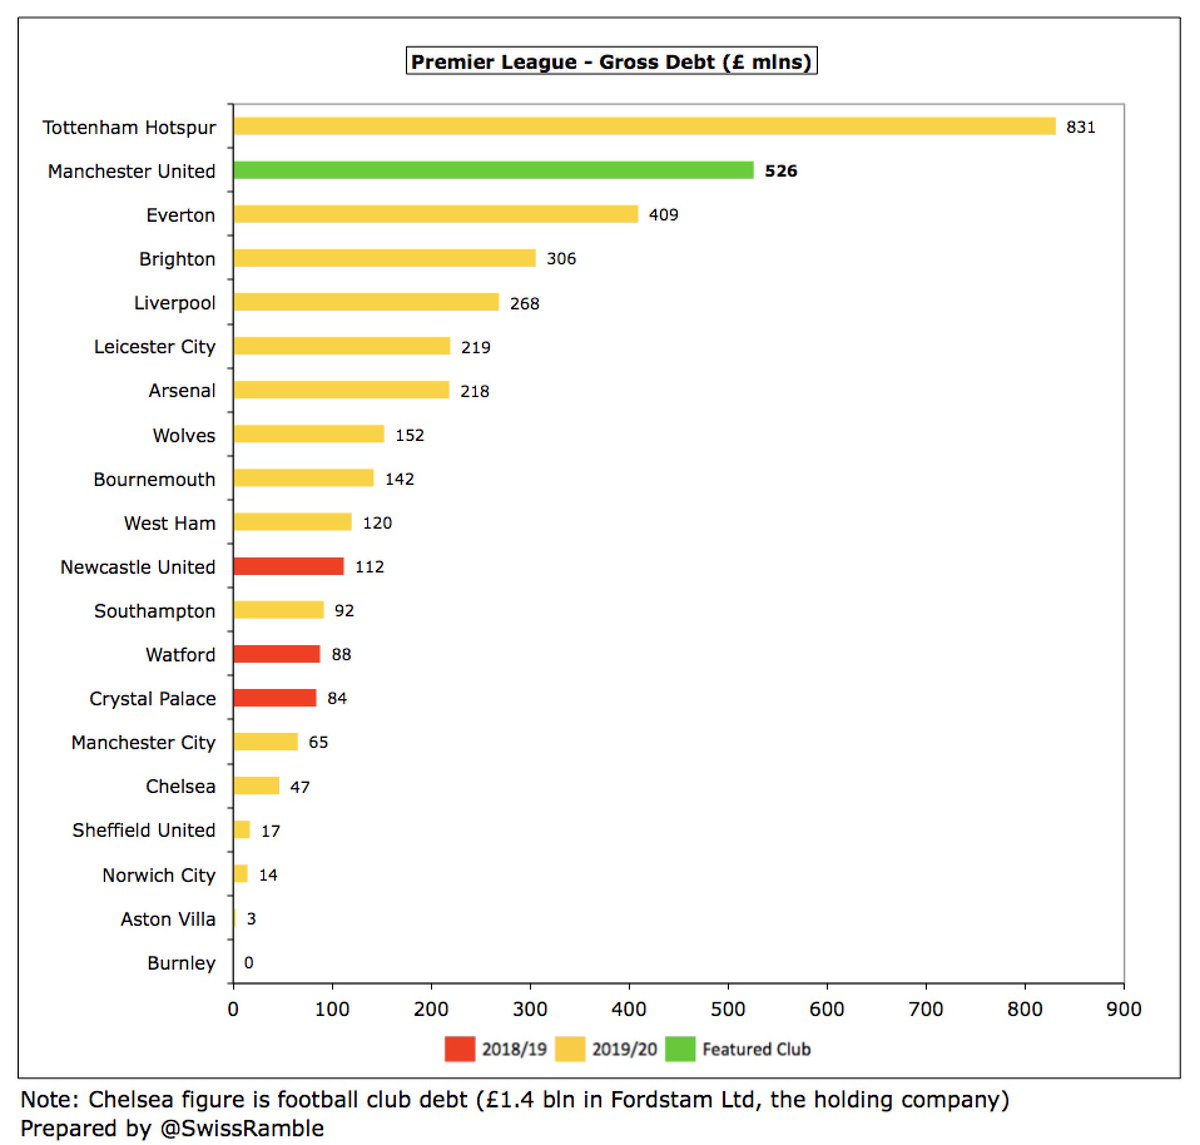
The harsh reality is that after all the Glazers financial engineering, #MUFC still have £526m debt, which is the second highest in the Premier League, only “beaten” by #THFC £831m. Therefore, the draining of the club’s resources will continue for the foreseeable future.
It is unclear whether the #MUFC protests will persuade the Glazers to sell up, but the supporters’ frustration with the owners is eminently understandable, and the overwhelmingly negative reaction to the Super League might just give them pause for thought.
• • •
Missing some Tweet in this thread? You can try to
force a refresh