Clarification -

The major indices are still in a bull-market (although ripe for a pullback).

The unwind is isolated to the hyper-growth stocks + SPACs which had appreciated significantly last year and become very over-extended.

Those names are now correcting prior excesses.
Late last year and in Jan/Feb, I kept saying that 400-500% gains in a year were NOT normal - normally stocks appreciate so much in 5 years (or more)!

So, ongoing sell-off is normal. So far ARK ETFs have given back ~35% of the entire gain, 50-62% retracement can't be ruled out.
Whenever an asset or market experiences gravity defying gains in a short period of time and that move ends with euphoria, 'this time is different' and price acceleration, the result is always the same - perfect bell curve and brutal decline/bust.

This is how bubbles form + pop.
Final thought -

Whenever over-extended stocks in one area start tanking after posting stellar operating results, that is a clear sign that the best has already been discounted.

Stocks top and bottom ahead of fundamentals (when best and worst have been discounted).

• • •

Missing some Tweet in this thread? You can try to force a refresh
 

Keep Current with Puru Saxena

Puru Saxena Profile picture

Stay in touch and get notified when new unrolls are available from this author!

Read all threads

This Thread may be Removed Anytime!

PDF

Twitter may remove this content at anytime! Save it as PDF for later use!

Try unrolling a thread yourself!

how to unroll video
  1. Follow @ThreadReaderApp to mention us!

  2. From a Twitter thread mention us with a keyword "unroll"
@threadreaderapp unroll

Practice here first or read more on our help page!

More from @saxena_puru

8 May
Reviewed price charts of all asset bubbles going back decades. Amazing how they all look so similar -

Parabolic rise/blow off, initial decline, base building for a few weeks, then final leg down.

All formed perfect bell curves + selling only stopped with oversold readings.
The *minimum* decline I could find was 50% retracement of the entire rally and most gave back 65-75% of their entire gains.

Past doesn't guarantee the future, but human nature hasn't changed - interesting times!
Here is a chart (few months old) which shows how all the previous asset bubbles ended - Bell Curves.

The current bubble went up a bit further early this year but seems to have popped. Was aware it was an incipient bubble, just didn't realise it'd pop before end of QE. Image
Read 4 tweets
30 Apr
1) Portfolio update Apr-end -

$ADYEY $AFTPY $AGC $CPNG $CRWD $CURI $DKNG $DOCU $GHVI $IPOE $MELI $OPEN $OZON $PATH $PINS $PLTR $ROKU $RTP $SE $SHOP $SFTW $SKLZ $SNAP $SNOW $TWLO $UPST

Portfolio is currently hedged

Short $ARKK

Contd...
2) Return since 1 Sept 2016 -

Portfolio +572.00%
$ACWI +69.66%
$SPX +92.60%

CAGR since 1 Sept 2016 -

Portfolio +50.37%
$ACWI +11.99%
$SPX +15.07%

Contd...
3) YTD return -

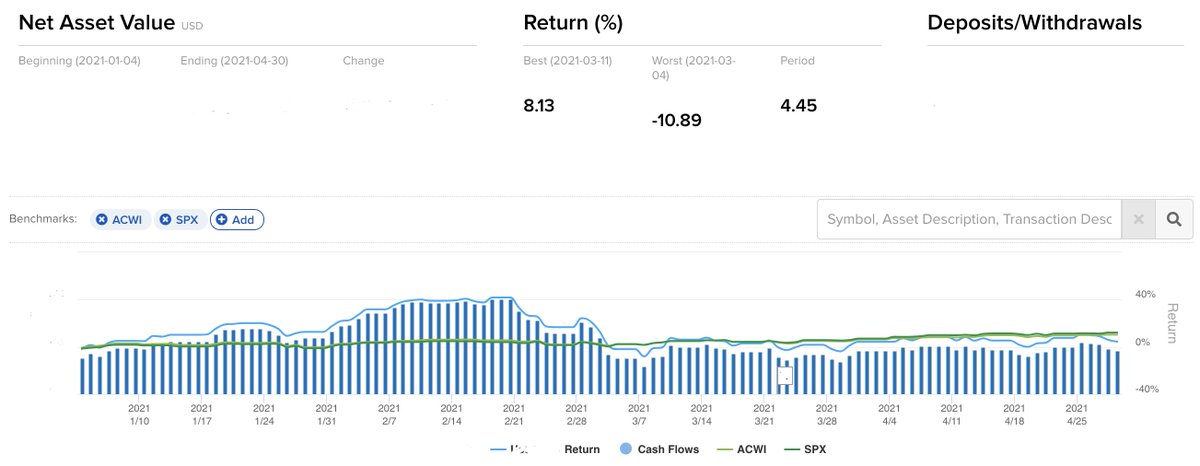
Portfolio +4.45%
$ACWI +8.6%
$SPX +11.32%

Biggest positions -

1) $MELI 2) $SE 3) $SNOW 4) $SNAP 5) $AGC

Contd....
Read 16 tweets
19 Apr
The rise in the number of COVID variants, scepticism towards jabs and the unavailability of vaccines in the developing world suggest that the 'reopening' might not happen as fast as hoped.

At the very least, international travel isn't likely anytime soon.
Some recent articles -

edition.cnn.com/2021/04/09/pol…
Read 8 tweets
1 Apr
1) Portfolio update Mar-end -

$ACTC $ADYEY $CCIV $CPNG $CRWD $CURI $DKNG $DOCU $GHVI $IPOE $MELI $OPEN $OZON $PINS $PLTR $RBLX $ROKU $RTP $SE $SFTW $SKLZ $SNOW $TWLO $UPST #NQ_F

Return since 1 Sep'16 -

My a/c +541.12%
$ACWI +61.93%
$SPX +83.01%
2) CAGR since inception (1 Sep '16) -

Portfolio +50.03%
$ACWI +11.10%
$SPX +14.11%

YTD return -

Portfolio +1.13%
$ACWI +4.88%
$SPX +5.77%

Cont...
3) Biggest positions -

1) $MELI 2) $SE 3) $UPST 4) $CPNG 5) $OZON

Commentary -

Wow! What a month!

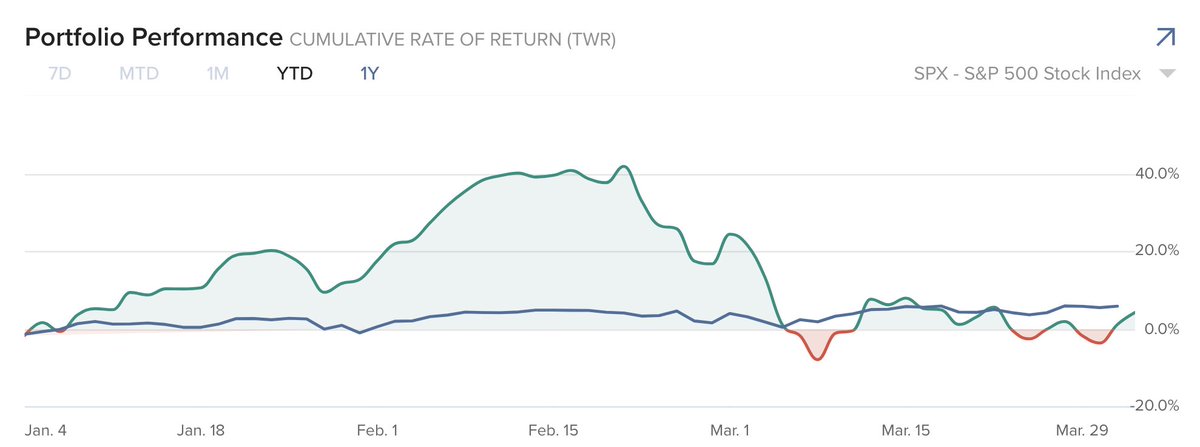
March turned out be a brutal month for growth stocks, consequently my portfolio suffered a large drawdown.

At the end of Feb, my YTD return was 16.94% and those gains...
Read 16 tweets
26 Mar
$ARKK has sliced through yesterday's lows 🚨
Since early March, this is now the 4th test of this area which is just around the 40-wk EMA.

Bulls want this line to hold; if it gives way, could get ugly!
Here is the *hourly* chart showing the line in the sand -

Note 4 tests of this area in March. $ARKK
Read 4 tweets
21 Mar
Stock market trend check -

1) $SPX

Primary trend = UP
Short-term trend = UP
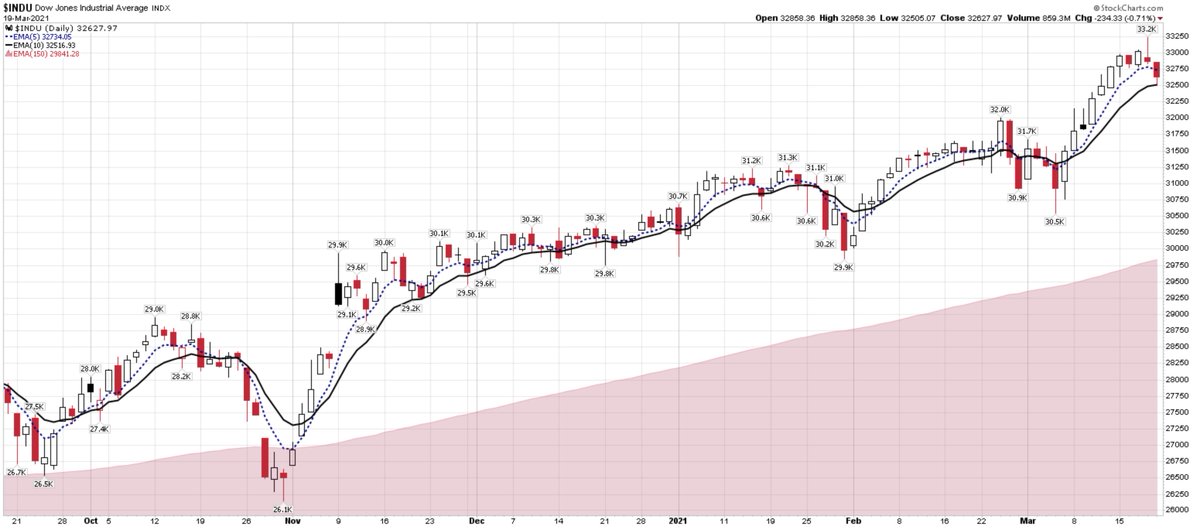
2) $INDU

Primary trend = UP
Short-term trend = UP
3) $NDX

Primary trend = UP
Short-term trend = DOWN
Read 5 tweets

Did Thread Reader help you today?

Support us! We are indie developers!


This site is made by just two indie developers on a laptop doing marketing, support and development! Read more about the story.

Become a Premium Member ($3/month or $30/year) and get exclusive features!

Become Premium

Too expensive? Make a small donation by buying us coffee ($5) or help with server cost ($10)

Donate via Paypal Become our Patreon

Thank you for your support!

Follow Us on Twitter!

:(