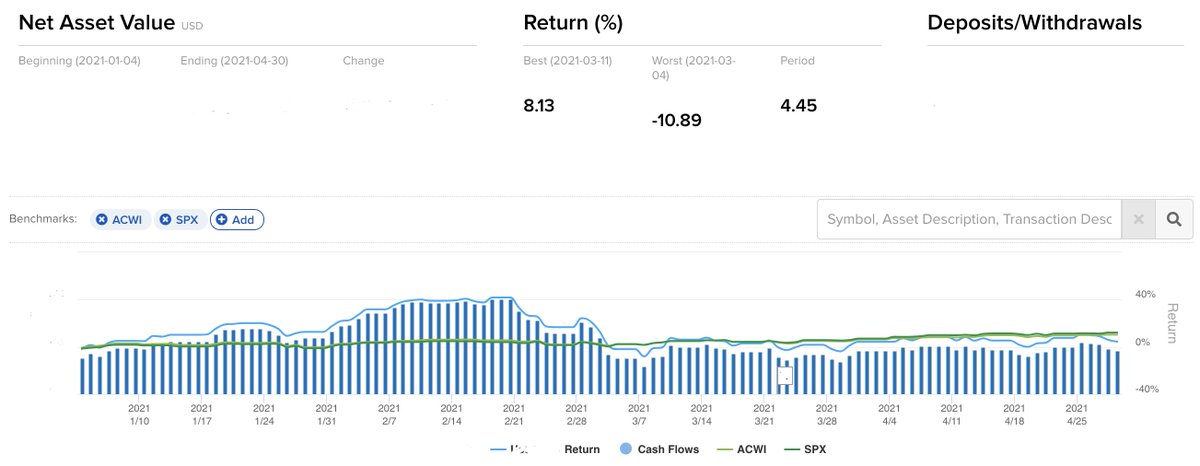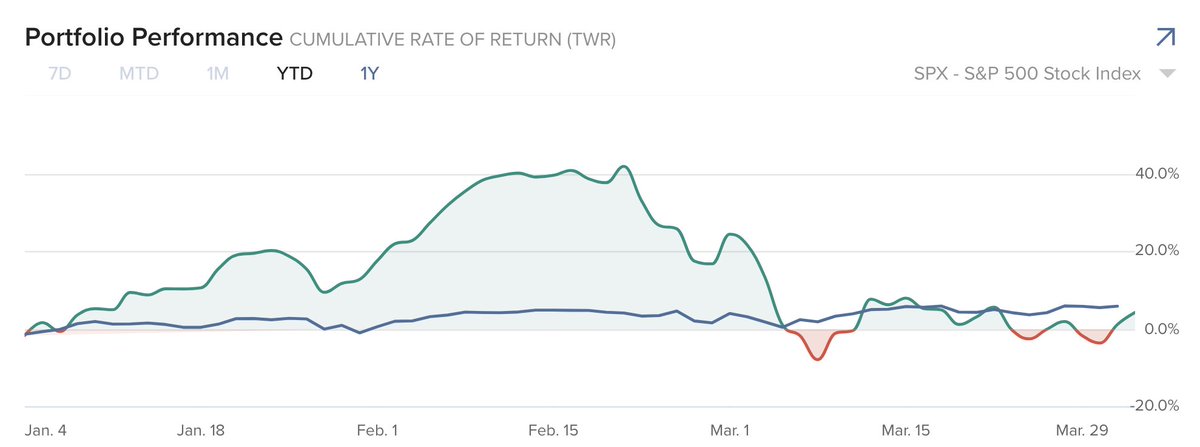
Reviewed price charts of all asset bubbles going back decades. Amazing how they all look so similar -
Parabolic rise/blow off, initial decline, base building for a few weeks, then final leg down.
All formed perfect bell curves + selling only stopped with oversold readings.
Parabolic rise/blow off, initial decline, base building for a few weeks, then final leg down.
All formed perfect bell curves + selling only stopped with oversold readings.
The *minimum* decline I could find was 50% retracement of the entire rally and most gave back 65-75% of their entire gains.
Past doesn't guarantee the future, but human nature hasn't changed - interesting times!
Past doesn't guarantee the future, but human nature hasn't changed - interesting times!
Here is a chart (few months old) which shows how all the previous asset bubbles ended - Bell Curves.
The current bubble went up a bit further early this year but seems to have popped. Was aware it was an incipient bubble, just didn't realise it'd pop before end of QE.
The current bubble went up a bit further early this year but seems to have popped. Was aware it was an incipient bubble, just didn't realise it'd pop before end of QE.

Timing the exact peak of the bubble in real-time is super hard, especially with an easy Fed. Historically, bubbles popped after Fed tightening which is what screwed up my timing with this one.
Called rally as incipient bubble many times in late '20/early '21 but missed the top.
Called rally as incipient bubble many times in late '20/early '21 but missed the top.
• • •
Missing some Tweet in this thread? You can try to
force a refresh


