Will get into definitions of class later - here is occupational class by values group from the @BESResearch random probability survey

The key point to take away:

Among both higher professionals and routine occupation groups more than 60% are on the 'left' BUT
For higher professional this is 35% Liberal, 17% moderate and 8% 'authoritarian'
For routine occupations this is 8% Liberal, 21% moderate and 31% authoritarian.

This is the challenge if you want to unite the 'left'
It really doesn't matter *how* you measure class you will find this divide - there are two options:

1. Make economics more salient where the common ground is
2. Find a way to at least talk to the 'moderates' on the 2nd dimension (together moderates + liberals are more than half)
I unpack it further in this piece using the 2017 election data

renewal.org.uk/wp-content/upl…
Details on measurements here (also using 2017 data)

medium.com/@psurridge/how…

• • •

Missing some Tweet in this thread? You can try to force a refresh
 

Keep Current with Paula Surridge

Paula Surridge Profile picture

Stay in touch and get notified when new unrolls are available from this author!

Read all threads

This Thread may be Removed Anytime!

PDF

Twitter may remove this content at anytime! Save it as PDF for later use!

Try unrolling a thread yourself!

how to unroll video
  1. Follow @ThreadReaderApp to mention us!

  2. From a Twitter thread mention us with a keyword "unroll"
@threadreaderapp unroll

Practice here first or read more on our help page!

More from @p_surridge

11 May
Class, values and voting - a thread ⬇️

Some debate today about how we should think about social class. Been a topic for the last 40 years in political sociology, not going to be resolved on twitter but for Labour it doesn’t really matter... /1
...as however you think of ‘working class’ Labour are losing in that group. The key to unlocking this (as shown in the thread) is thinking about economic and social values (which have their roots in social positions) and how people engage with these as identities.

/2
First ‘class’ measured by occupation, housing and social grade

Bars show the Con lead over Lab, lines show distribution of electorate across the categories

/3 Image
Read 14 tweets
11 May
A snippet from the Rotherham Borough Council vote validation via rotherham.gov.uk/elections-voti…
We are reading so much into what 'Red Wall' and other voters think from the votes of < 1/3rd of voters who are far from a random sample of voters in a given area.

It is information to use, but it is a long way from perfect information and should be used with caution.
Also is it too much to ask that councils reported this in a standardised way?
Read 5 tweets
26 Feb 20
A short thread on my piece (behind paywall) here:

journals.sagepub.com/doi/full/10.11…

I look at groups of seats either lost or gained by Labour in 10 or 15 vs those lost or gained in 17 or 19 to set up a comparison pre Brexit and Corbyn and post-Brexit and Corbyn.
First, evidence on EU referendum vote. Seats lost in 2010 or 2015 are as 'leave' voting as those lost in 17 or 19
Seats lost 10/15 are very similar to seats lost 17/19 in terms of socio-economic characteristics. (And potentially worryingly for Labour those held on to are more similar to losses than gains)
Read 6 tweets
4 Feb 20
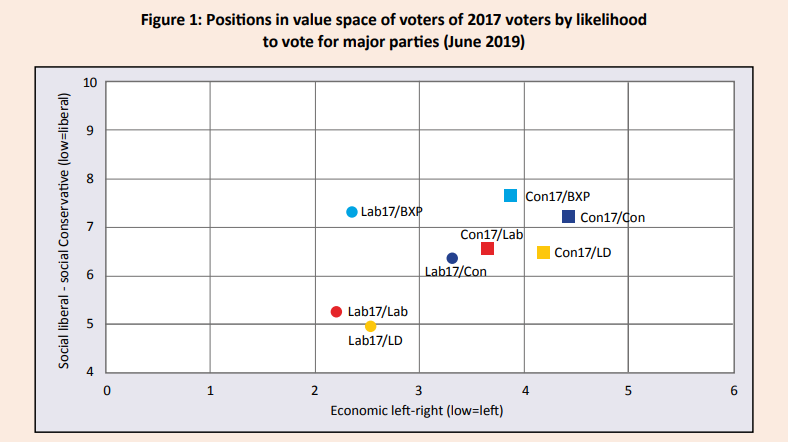
My piece from @UKandEU report out today shows the value positions of voters for Labour and Conservatives in 2017 by the parties they were likely to vote for in June 2019 1/n
Some key points:

The divide between Lab17/Lab and Lab17/LD vs Lab17 and Brexit Party is well known now and a challenge for Labour to unite those voters 2/n
But the Lab17/Con voters are different on both social values (closer to all groups of Con17 voters than Lab17 voters) *and* on economics. This matters because these switchers cost Labour twice (as a loss to them and a gain for Conservatives). 3/n
Read 5 tweets
13 Jan 20
Something even more long-term to illustrate how the Labour vote has changed. Between 92 and 2010 the Labour voters were in roughly the same average position on social liberalism scale (scales run -2 - +2 low is lib and left) more or less in the centre of the scale (at 0) 1/3
They moved on average to a more liberal position in 2015 (as they gained liberal voters from LDs and lost socially Conservative voters to UKIP). This was further compounded in 2017. 2/3
Will need to wait a few months to be able to add the 2019 point - anyone fancy a game of pin the Labour vote on the chart? 3/3
Read 4 tweets
27 Mar 19
Wow, the latest @yougov poll has don't know running at more than 1 in 5 of pretty much every socio-demographic grouping and all previous votes. There is huge volatility in the system which may or may not be realised by the 'other' parties. Some other note worthy figures:
Among remainers 'Other party' (Not Lab/Cons/LD or SNP) is only at 6% but 2/3rds of these give Green as the other party. Among leavers 15% are saying 'other' party and Brexit party is polling higher than UKIP (perhaps confirming my hunch Farage brand > UKIP brand)
Not from this poll, but the number of signatures (or % of signatures) on the revoke article 50 petition correlates quite highly with 2015 Green Party vote (r=0.58) and not at all with 2017 Labour share.
Read 4 tweets

Did Thread Reader help you today?

Support us! We are indie developers!


This site is made by just two indie developers on a laptop doing marketing, support and development! Read more about the story.

Become a Premium Member ($3/month or $30/year) and get exclusive features!

Become Premium

Too expensive? Make a small donation by buying us coffee ($5) or help with server cost ($10)

Donate via Paypal Become our Patreon

Thank you for your support!

Follow Us on Twitter!

:(