, 4 tweets, 1 min read
My Authors
Read all threads
Something even more long-term to illustrate how the Labour vote has changed. Between 92 and 2010 the Labour voters were in roughly the same average position on social liberalism scale (scales run -2 - +2 low is lib and left) more or less in the centre of the scale (at 0) 1/3
They moved on average to a more liberal position in 2015 (as they gained liberal voters from LDs and lost socially Conservative voters to UKIP). This was further compounded in 2017. 2/3
Will need to wait a few months to be able to add the 2019 point - anyone fancy a game of pin the Labour vote on the chart? 3/3
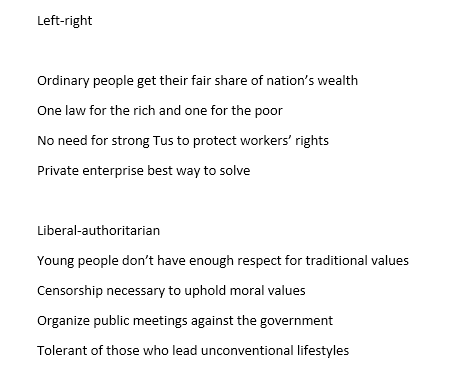
The measures are a little different to usual to get the time series, only 4 items per scale consistent in all years.
Missing some Tweet in this thread? You can try to force a refresh.

Enjoying this thread?

Keep Current with Paula Surridge

Profile picture

Stay in touch and get notified when new unrolls are available from this author!

Read all threads

This Thread may be Removed Anytime!

Twitter may remove this content at anytime, convert it as a PDF, save and print for later use!

Try unrolling a thread yourself!

how to unroll video

1) Follow Thread Reader App on Twitter so you can easily mention us!

2) Go to a Twitter thread (series of Tweets by the same owner) and mention us with a keyword "unroll" @threadreaderapp unroll

You can practice here first or read more on our help page!

Follow Us on Twitter!

Did Thread Reader help you today?

Support us! We are indie developers!


This site is made by just three indie developers on a laptop doing marketing, support and development! Read more about the story.

Become a Premium Member ($3.00/month or $30.00/year) and get exclusive features!

Become Premium

Too expensive? Make a small donation by buying us coffee ($5) or help with server cost ($10)

Donate via Paypal Become our Patreon

Thank you for your support!