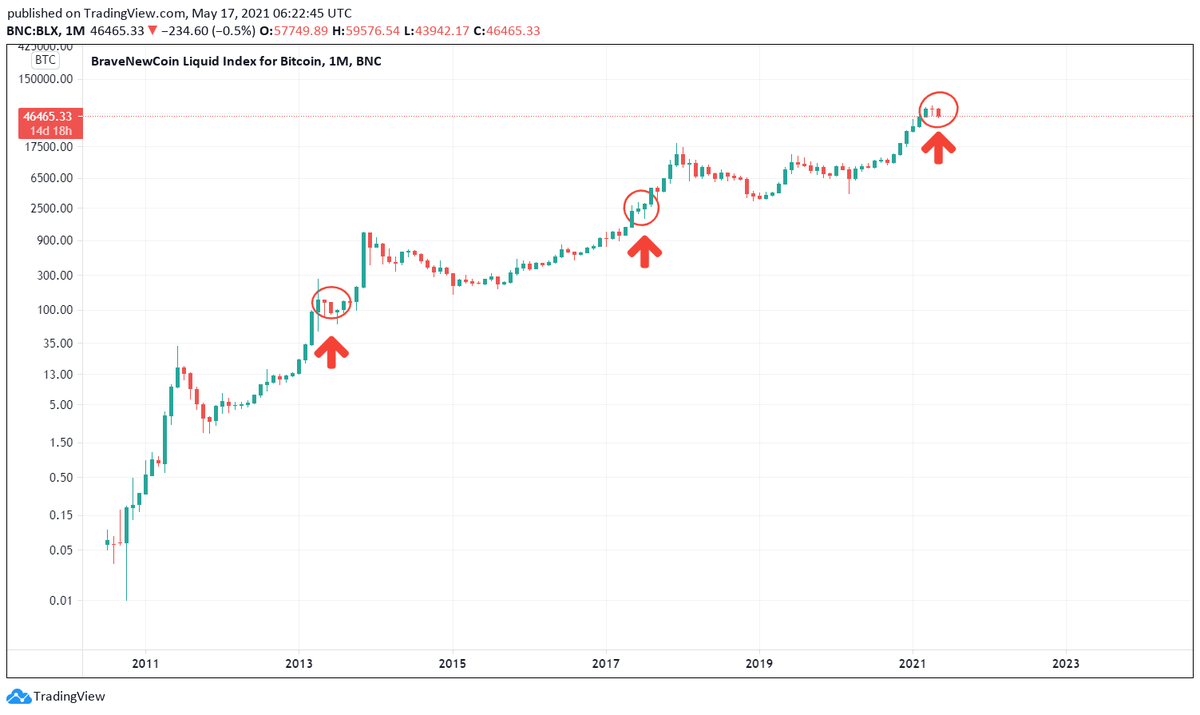
Amid all the gloom & doom about #BTC, let's do some in depth TA!
4-year cycle broken? V-shaped rebound? When? Seen correction low?
TLDR:
1 BTC price is tracking past cycles'
2 Price dump expected today
3 There could be a lengthening of this cycle
4 Peak price: $260K-$360K
4-year cycle broken? V-shaped rebound? When? Seen correction low?
TLDR:
1 BTC price is tracking past cycles'
2 Price dump expected today
3 There could be a lengthening of this cycle
4 Peak price: $260K-$360K
1/ #BTC's recent price action is puzzling as it doesn't seem to follow the previous cycles'.
I was perplexed until I zoomed out & looked closely at the monthly BLX log chart to find my bearings.
BTC's price action is tracking its previous cycles'! BTC's 4-year cycle is intact.
I was perplexed until I zoomed out & looked closely at the monthly BLX log chart to find my bearings.
BTC's price action is tracking its previous cycles'! BTC's 4-year cycle is intact.

2a/ I'm tracking the @HalvingTracker charts, but I've been looking at the wrong portions of the charts of previous cycles (🔵).
Using the monthly BLX log chart, I found out where #BTC is at (🔴) and where it is supposed to be in previous cycles and it all makes sense!
Using the monthly BLX log chart, I found out where #BTC is at (🔴) and where it is supposed to be in previous cycles and it all makes sense!

2b/ #BTC is tracking the monthly price action of the 2013 bull phase closely.
However, in terms of price action from the no. of days after the halving, #BTC is trading similar to that on 372 days after the halving in 2017, while it's currently at 371 days after the halving.
However, in terms of price action from the no. of days after the halving, #BTC is trading similar to that on 372 days after the halving in 2017, while it's currently at 371 days after the halving.

2/c Thus, in terms of price action in this cycle, #BTC is off by only 1 day from that in 2017!
A big dump is expected to happen today exactly as it has played out regardless of Elon's tweet.
A big dump is expected to happen today exactly as it has played out regardless of Elon's tweet.

2d/ Could #BTC's price go lower from here?
If it behaves like that in the 2017 cycle, the dump is over & price will begin its V-shaped rebound.
If it follows the 2013 bull phase, #BTC will have a lower low next month, but rebound to close out with a monthly green candle.
If it behaves like that in the 2017 cycle, the dump is over & price will begin its V-shaped rebound.
If it follows the 2013 bull phase, #BTC will have a lower low next month, but rebound to close out with a monthly green candle.
3/ From the same period today in the last 2 cycles, it took #BTC 5 months to reach its respective peaks in those cycles.
If everything plays out as expected, that will put #BTC's current cycle peak in October 2021 rather than September 2021.
👀
If everything plays out as expected, that will put #BTC's current cycle peak in October 2021 rather than September 2021.
👀

4a/ What is the projected peak #BTC price in this cycle?
Using Fib Extensions, #BTC topped put between 3.618 Fib and 4.618 Fib in the last 2 cycles. If this plays out in this cycle, #BTC's top price is ~$260K.
Using Fib Extensions, #BTC topped put between 3.618 Fib and 4.618 Fib in the last 2 cycles. If this plays out in this cycle, #BTC's top price is ~$260K.

4b/ For reference, connecting the 2 previous #BTC's cycle peaks with a trend line, BTC peak price is determined to be:
9/21 Peak: $260K
10/21 Peak: $280K
9/21 Peak: $260K
10/21 Peak: $280K
4c/ Assuming the trend angle for each bull phase move is 3° less in each succeeding cycle, the #BTC peak price is determined to be:
9/21 Peak: $260K
10/21 Peak: $360K
If the trend angle is an average between the last 2 cycles', #BTC's peak price is much higher!
Will update.
9/21 Peak: $260K
10/21 Peak: $360K
If the trend angle is an average between the last 2 cycles', #BTC's peak price is much higher!
Will update.

• • •
Missing some Tweet in this thread? You can try to
force a refresh


