Okay, let's talk about what we know about mail-in ballots and how the affected turnout Tuesday. I talked about some of this in a thread yesterday you can find here: bit.ly/3f1MLfT 1/24
The running idea in that thread was that we were going to see some interesting turnout results for the primary, in large part due to mail-in ballots and the voter referendums; which gave non-major party voters a say in statewide ballot questions. bit.ly/3eY1p88 2/24
Voters chose to limit the disaster declaration powers of the Gov's office, btw. You can read more about that in a story by .@candynotcandace linked below. We might touch a little bit on that later, but for now MAIL BALLOTS! bit.ly/3fwgjBp 3/24
So, as of yesterday, mail-in ballot requests for Tuesday's primary were accounting for between 4% and 13% of registered voters in counties across the commonwealth. If only mail-in ballot requests were counted, Bucks County would have had 11% turnout 4/24 

Bucks County's turnout was ... considerably higher. Usually, we see between 11% and 15% turnout for municipal primaries. Tuesday had about 25.5% turnout. The last time the county broke 20% turnout was in the 2007 muni primary bit.ly/3yrGB0g 5/24
So large was the turnout that I struggled to write that last post without using swear words. That's really a shame, because I can be pretty inventive like that. Anyway, to explain why I was caught so off guard, I have to talk about this map. 6/24
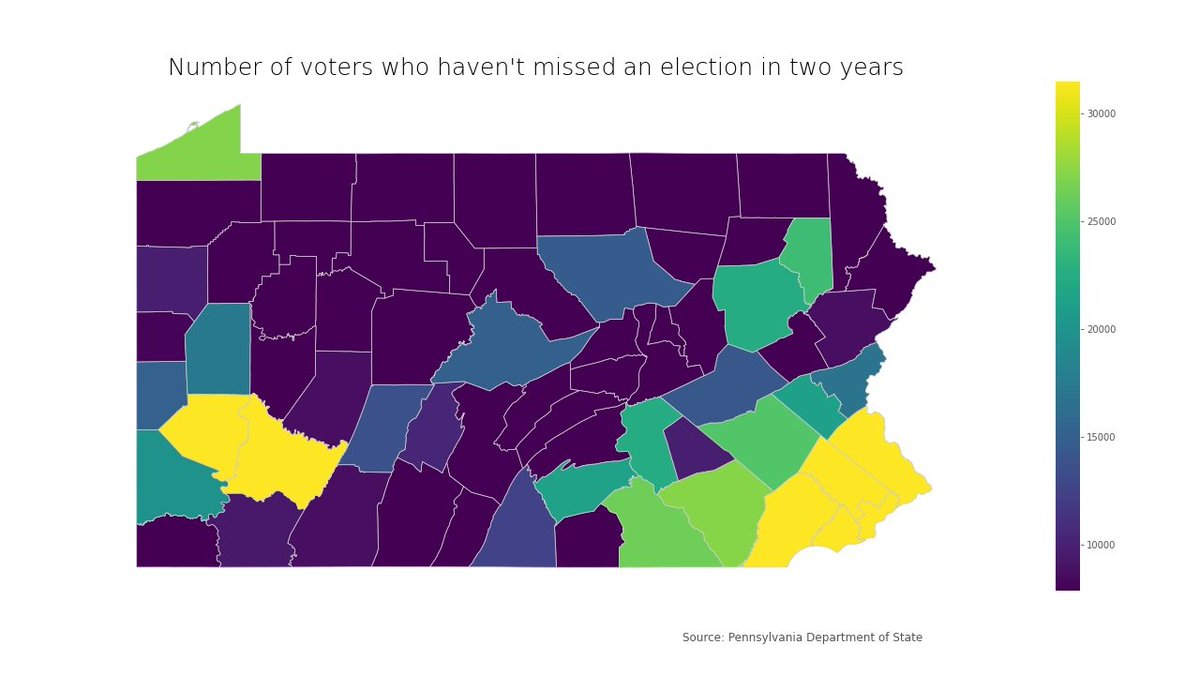
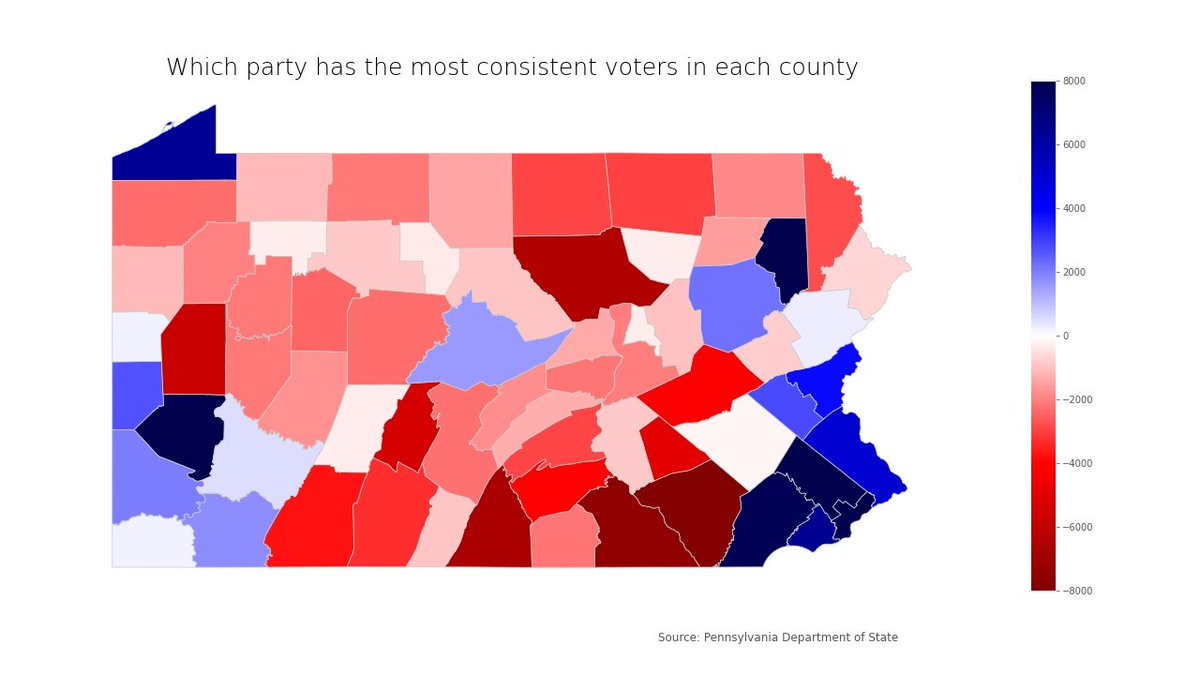
In today's story I went over what I've been referring to as "consistent voters," or currently registered voters who haven't missed an election in two years. Bucks County has about 47,000 of them, according to state data updated Monday. Alone, they make up 10% of our voters 7/24

Naturally, I just kind of assumed there would be some overlap between the die-hard voters and the 54,141 mail-in ballot requests. "Surely," I thought, "Surely we'll see an average or slightly above average turnout on Tuesday." bit.ly/2RrQ8Ux 8/24
After all, this map, which I ominously post without further explanation as if to foreshadow some kind of importance later on in this thread, couldn't suggest otherwise, right? 9/24
I mean, I had an anecdotal example from yesterday one Doylestown Township district, which had a little over 260 consistent voters total. That district had just over 230 in-person ballots as of 4 p.m., with 171 of over 300 mail-in ballots requested in as of last Friday. 10/24
Turns out, about the same time in Penndel, about 200 voters had come in to cast a ballot in person, though we didn't know the mail-in ballots there. At around 8, in Lower Makefield South 7, about 303 in-person votes came in, with at least 121 mail-in ballots registered. 11/24
Thanks to @pegquann for getting those numbers as she visited lower Bucks polls yesterday. I don't want anyone reading this to think I was working that hard. Now, let's talk about the Lower Make district first... 12/24
That district has about 241 consistent voters, so higher turnout there was definitely a mix, factoring in those 121 mail-in ballots. That same district also saw about 469 (nice) votes for one of those referendums, suggesting 45 more ballots cast what they knew then. 13/24
In Penndel, that same referendum saw 409 votes cast, roughly double the approximately 200 in-person voters we had at 4. The district also has 188 consistent voters 14/24
Now, we won't have certified results until sometime next week, possibly. That's when we'll know the party breakdowns and which precincts saw more in-person voters, etc.That said, I think we're going to see in person close to consistent voters and mail-ins adding on. 15/24
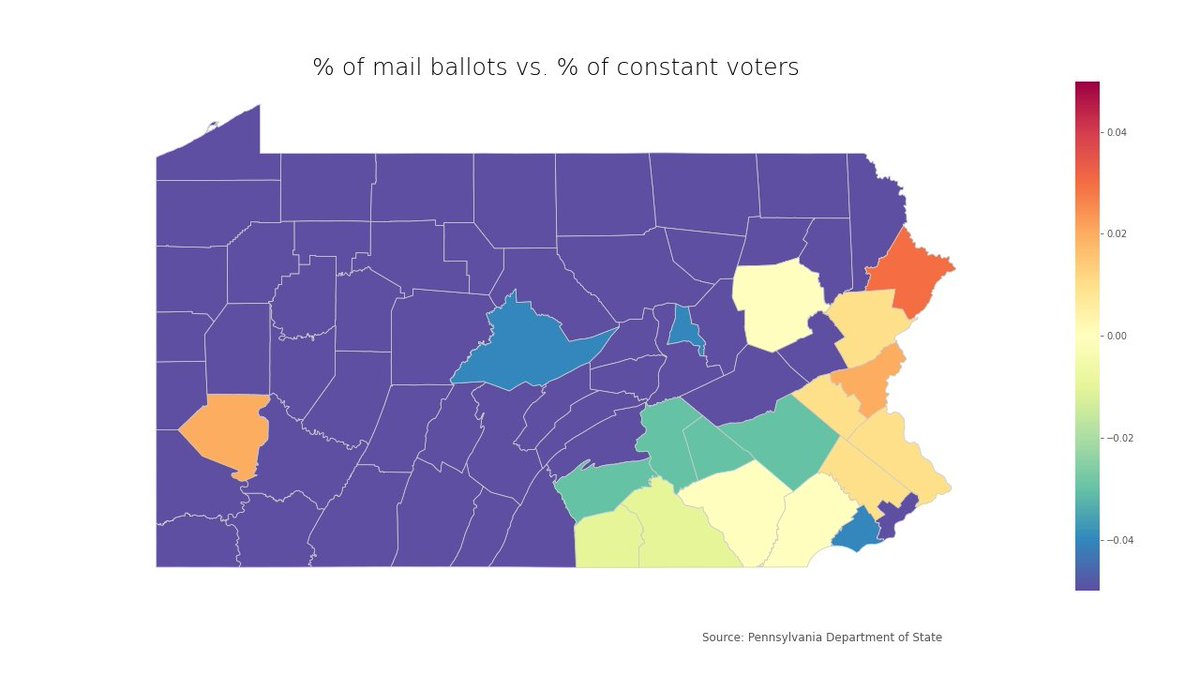
The reason why is because of this map. When we compare the totals of consistent voters and mail-ballot requests as a percentage of total voters, the mail ballots lead by multiple percentage points in several counties. Yes, Bucks is one of those counties 16/24
In fact, if we assumed they all voted and no overlap between the two, we'd have about 21% voter turnout on that alone. But that still isn't entirely why I feel so confident in that hypothesis. It's because I forgot something really important yesterday! 17/24

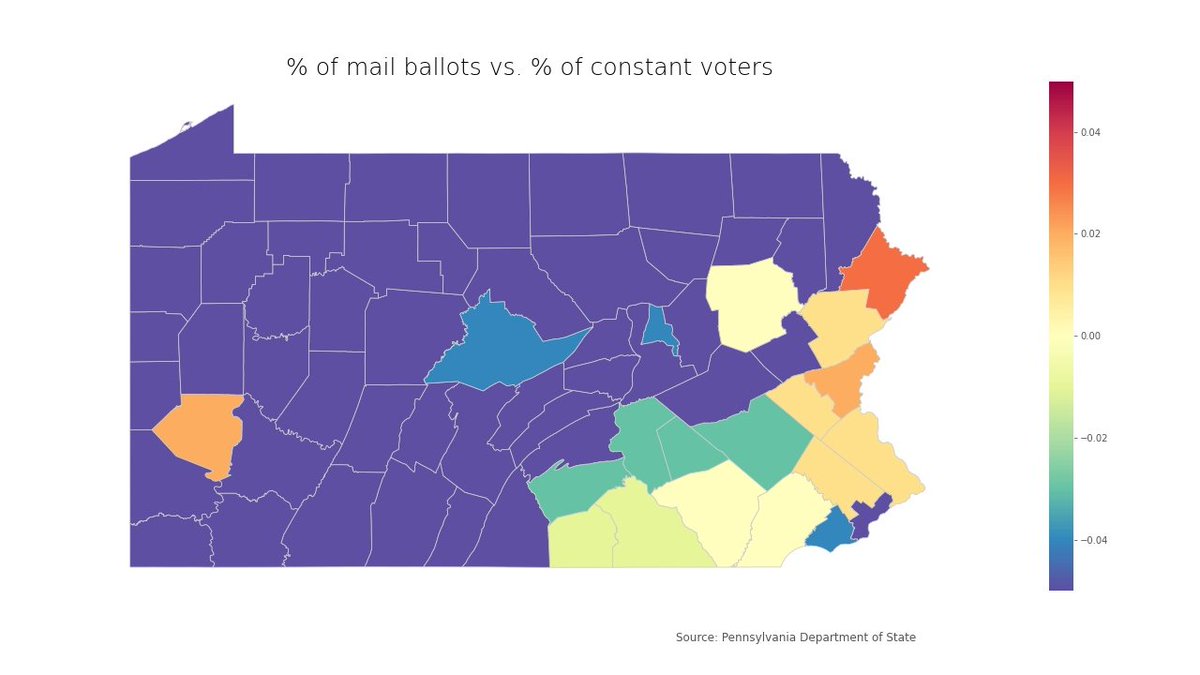
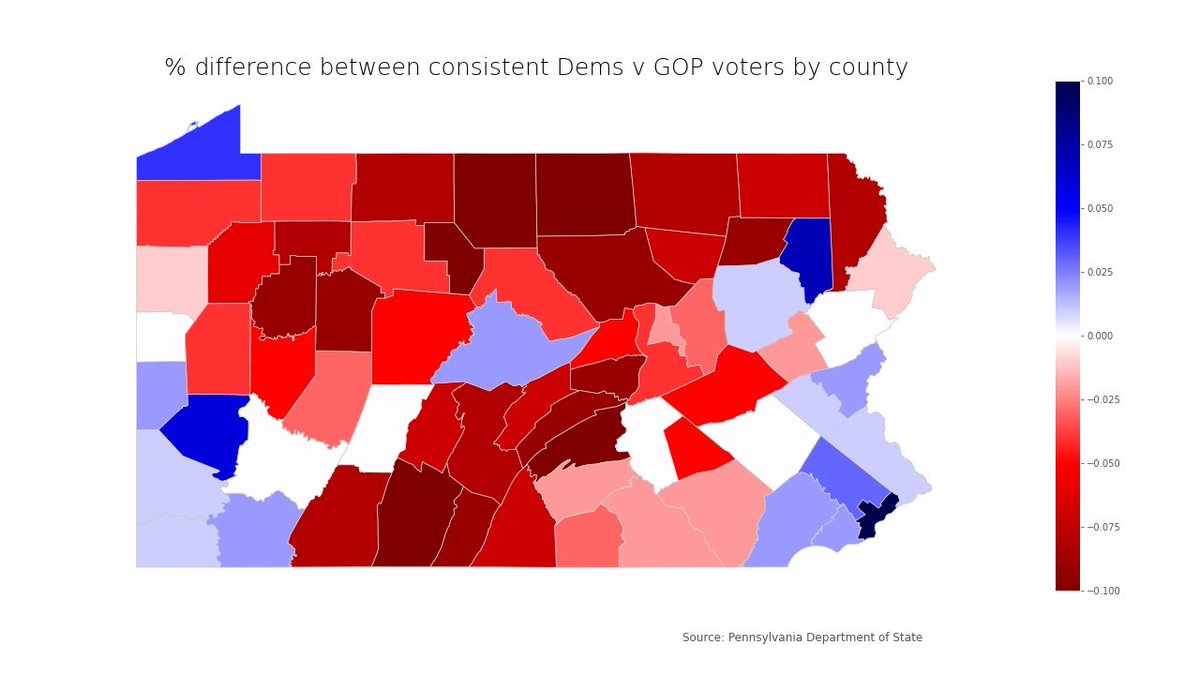
I didn't include this map yesterday because I was comparing consistent GOP voters to consistent Dem voters by county. Really more useful for Nov. 3. Of course, might also explain why some of those disaster referendums went the way they did too but... later .. later 18/24
While we can see which parties have higher percentages of active voters, we can't get a clear picture of consistent non-major party voters. What we need is a consistent (voted in last two general elections) indie voter map ... 19/24
And, wouldn't you know it, they make up between 1% to 4% of voters in each county. More specifically, they make up about 3% of Bucks County voters, bringing us a little closer to that 25% mark 20/24
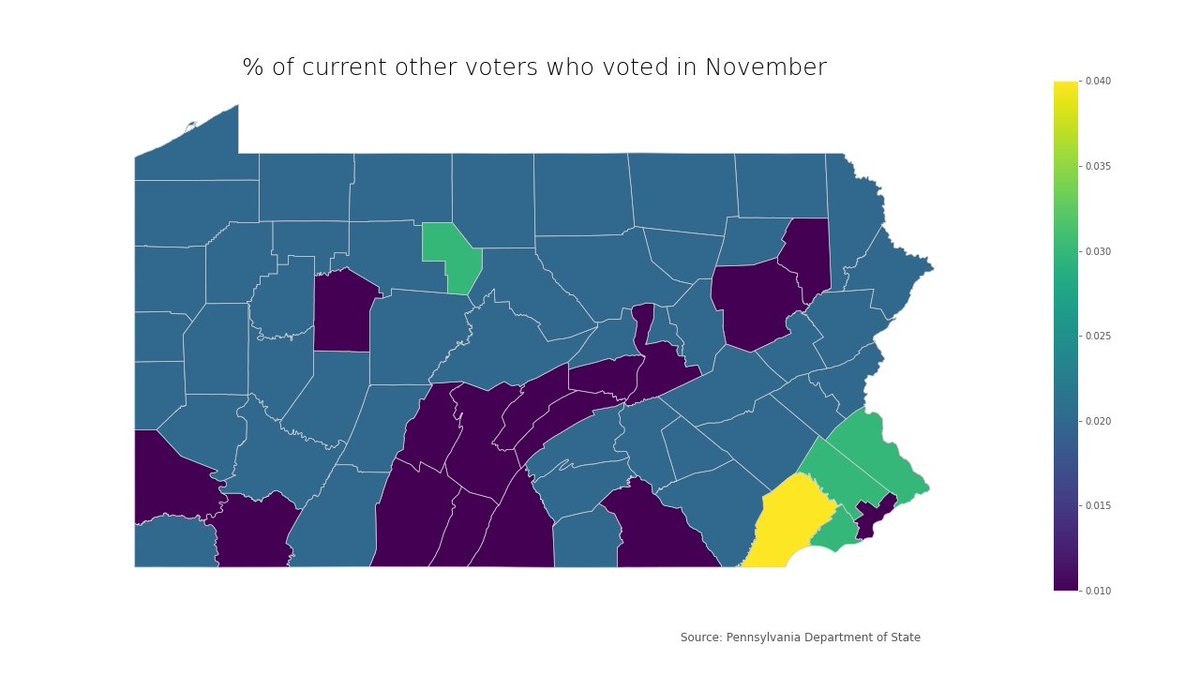
I think we're gonna see this next week: consistent voters led the charge in person, mail ballots helped push that turnout further, and ballot questions will factor into to totals on both. 21/24
The reason all of this matters? Election workers were at the county offices until about 3 a.m. today, and one county official told me it took 12 hours to prepare the mail ballots to be counted before polls closed Tuesday. 22/24
All other historic factors aside from November, Mail ballots aren't going anywhere and they're probably going to drive greater turnout in the future. State laws prevent pre-canvassing before 7 a.m. on an election day, and reform is going to be an ongoing issue this year 23/24
If you've made it this far, thank you and I hope it was informative. As always, this @py_data_sci inspired project uses @matplotlib @geopandas in a @ProjectJupyter notebook. @threadreaderapp Unroll please. 24/24
• • •
Missing some Tweet in this thread? You can try to
force a refresh