Cash-in-Circulation (CiC) dynamics- thr is a myth that RBI has been printing new money significantly causing CiC to trend up,or people hoarding cash etc. With RBI annual report out,we hv detailed data on both CiC (denomination wise) as well as printing of notes from mint.
As can be seen, growth rates are stable. Of course, this is gross new notes printed by mint. Given we have CiC denomination wise from 2 years, we can also calculate the notes extinguished or withdrawn from circulation as well, and what matters is net supply by RBI to economy
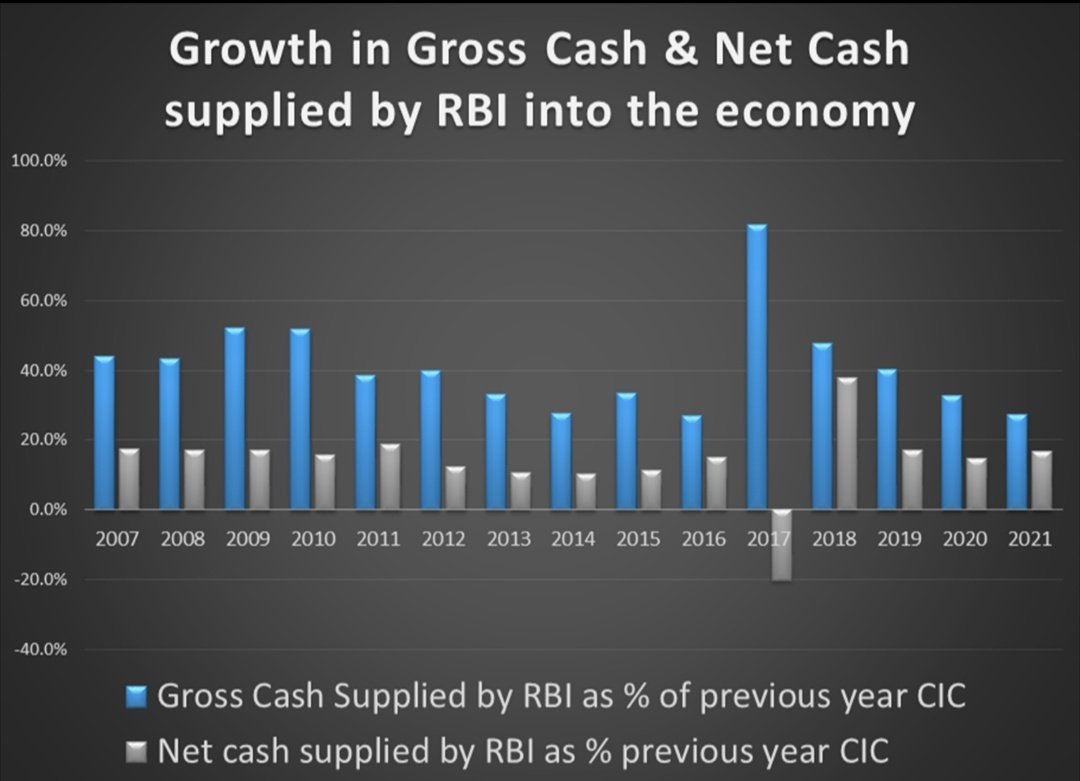
Net supply has been lower like in the past few years,however, if we slice the data on High Value Denomination (HVD) (500/1000/2000), one gets a slightly different picture.
Net supply of HVD Notes have grown at faster clip in FY21, even as gross supply of HVD has slower growth
So the issue is with extinguishing of notes not necessarily of printing new notes. I suspect, each note has a particular velocity with which it circulates in the economy before reaching the currency chests back when RBI MAY choose to extinguish it
Close to 30% of 2000 Rs notes have been extinguished from circulation over last 2 years, this rate is for sure higher than normal rates, but can it be more higher or lower, only algos in RBI will know
As percent of GDP, plotted the fresh printing, cash withdrawn from circulation and net supply (see the dip in blue line), this is causing the (in) famous CiC to GDP metric to optically trend up
Had written bfr tht RBI extinguishes notes every 2nd qtr in a fiscal & generally,change in CiC as percent of GDP goes negative,whereas in FY21, it was positive. This thread👇also shows cash withdrawals by public hv been flatlining for almost 17 qtrs now
In summary,rather than focusing on CiC as % of GDP,if one focuses on cash withdrawals by public, net cash printed by RBI into economy as well as rising use of digital txns, we get a different narrative rather than "cash hoarded by public ⏫" or "black money increasing⏫⏫" etc..
Was pointed to source data from RBI by Gautam (Spark Capital) & Nikhil (Motilal), many thanks🙏
FIN!
Worded this wrong, it is not that RBI waits for Sep qtr to withdraw notes fro circulation, they do it all the time. The dip in cash is more a function of seasonality of cash withdrawals and cash deposits (lead by farming cycles)
Seeing quite a few posts on record high P/E ratios etc of Indian equities. Small theoretical exercise to potentially highlight the optical nature of a ratio like trailing P/E ratio especially in context of a massive shock like Covid
Assume a 2 stock index, company A which is generally been a compounder & has a resilient biz model and company B which was barely growing and vulnerable to shocks (either high fixed costs or high debt)
Come the lockdown in March,A sees a sequential decline in profits,from June qtr & Sep qtr, YoY growth slowdown is even more sharper,bfr stabilising in Dec qtr & given low base of Mar 20,Mar 21 qtr YoY surges. Growth for year FY21 is at 17% compared to 20% it achieved pre-covid
Extremely low odds of instant gratification vs significantly higher payoffs of delayed wealth creation!
Fascinated by lottery sales explosion in Kerala(last year was approx 12000cr).Over 79 million lottery tickets sold every week in the state which has a population of just 33 mn
Compare this to total net flow to equity mutual funds last year of 1500cr from Kerala!Former has such low odds of instant gratification while latter has demonstrable much higher odds of wealth creation if held for decades,& yet...
Kerala lotteries have grown at a phenomenal pace. In 2009-10, total revenue of kerala lotteries was 625cr (i.e revenues went up 20x in a decade), while profits have showed a similar trend (from about 100 cr to arnd 2500cr, net profit margin have been 21-24%,last few years)
Thread on govt claims on our consumption!As citizens,imp to see how our consumer spends get paid to govt in form of taxes.While there r analysis on total tax paid to govt etc on fuel/car etc,idea is to look at total aggregate private consumption & see center+state indirect taxes!
It amazes me that over last 30 years toral taxes paid to govt from our consumer wallets is broadly been in a narrow range of 16-21%.we have seen service tax (1995),VAT(2005), GST(2017)- major changes of taxation in these 30 years, across multiple govts and biz cycles
Our consumer spends have massively changed over last 30 years,towards more affluent categories over time.One time settlement,compliance or lack of it have all been narrative that have made to headlines often.Yet optically it appears there hasn't been much change!
Casual reading of this chart by @MilanV spins 2 popular narratives of day - 1 capture by few cos(regulatory capture,invincible moats etc) that they become larger.2 In polarised mkt,where few performing,so follows only handful co worth investing! Alternative narratives possible?
Looking under hood suggests alternate narratives!Listed universe(approx 5k cos)shows trend of top 20 profit share of all PAT of 5k cos going from 40%to 65%(2009-2019).But,plot top 20 cos profit share of profit pool of only profitable cos shows flattish trend at 43% over 10 years
So,rather than regulatory capture etc causing dominance of chosen few,top 20 share is function of how loss pools have moved.Large losses in banks,telcos,infra,overseas acquisition gone wrong etc meant aggregate loss pool has zoomed from single digits to 55% of total profit pools!
Small thread on household debt servicing capability-chart from CS where Chinese household debt service as % of disposable income has moved from 17% in Mar-14 to almost 35% now! A third of income to debt servicing in an environment of massive economic/health shocks is worrying..
"Overdue credit-card debt swelled last month by about 50% from a year earlier, according to executives at two banks who asked not to be named discussing internal figures."
In China, household debt has grown at 23% while household incomes have grown at 12%.Household debt has grown to 100% of income!Mortgages account for 50%+ of these loans.Nearly 66% of outstanding mortgage debt last year was owed by families who already own more than one property.
A thread on key changes over a block of 5 years (2014-19) compared to previous 5 years (2009-13) , key avenues for govt inflows and key spends by govt. Please note these are not actual inflows/ spends, but difference in inflows/spends
1. Oil savings on count of higher taxes (made possible with fall in global crude), as well as reduction in subsidies (which has been a significant reform) has been the biggest delta source for govt finances. Thank goodness for this windfall!
2. For states, this increase in oil has primarily gone into loan waiver for farmers