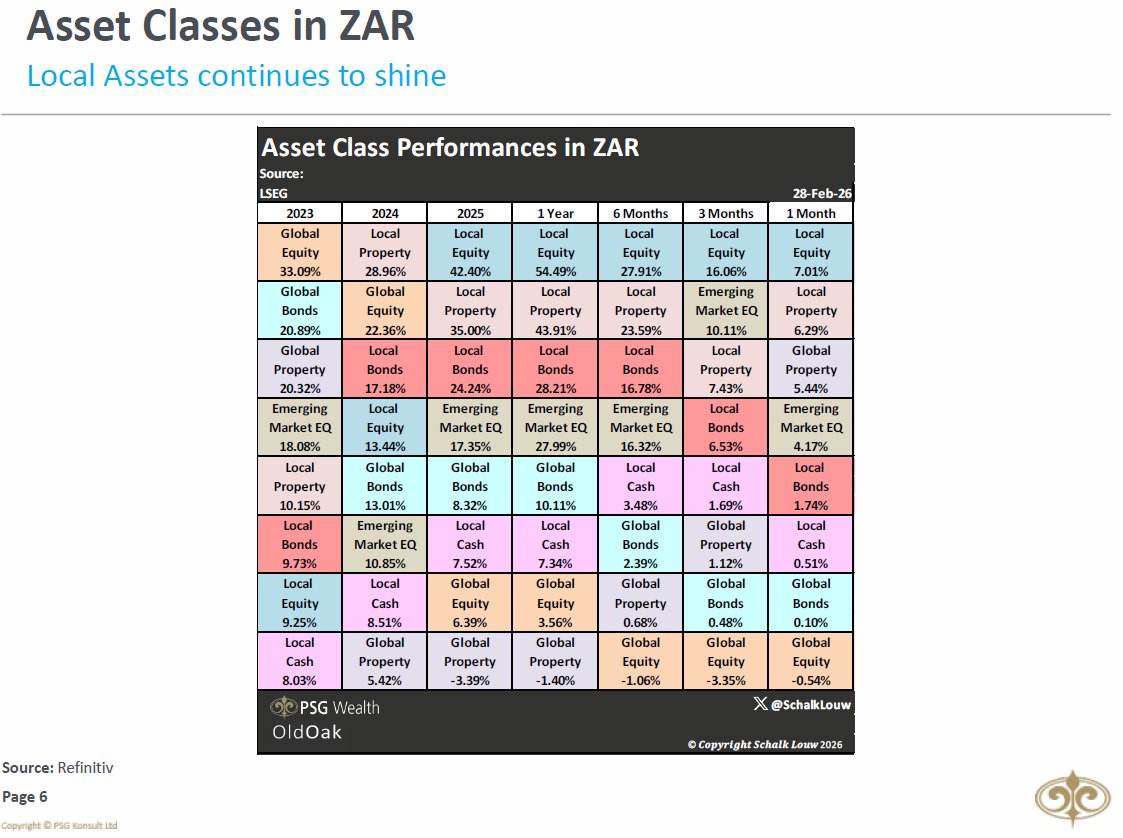
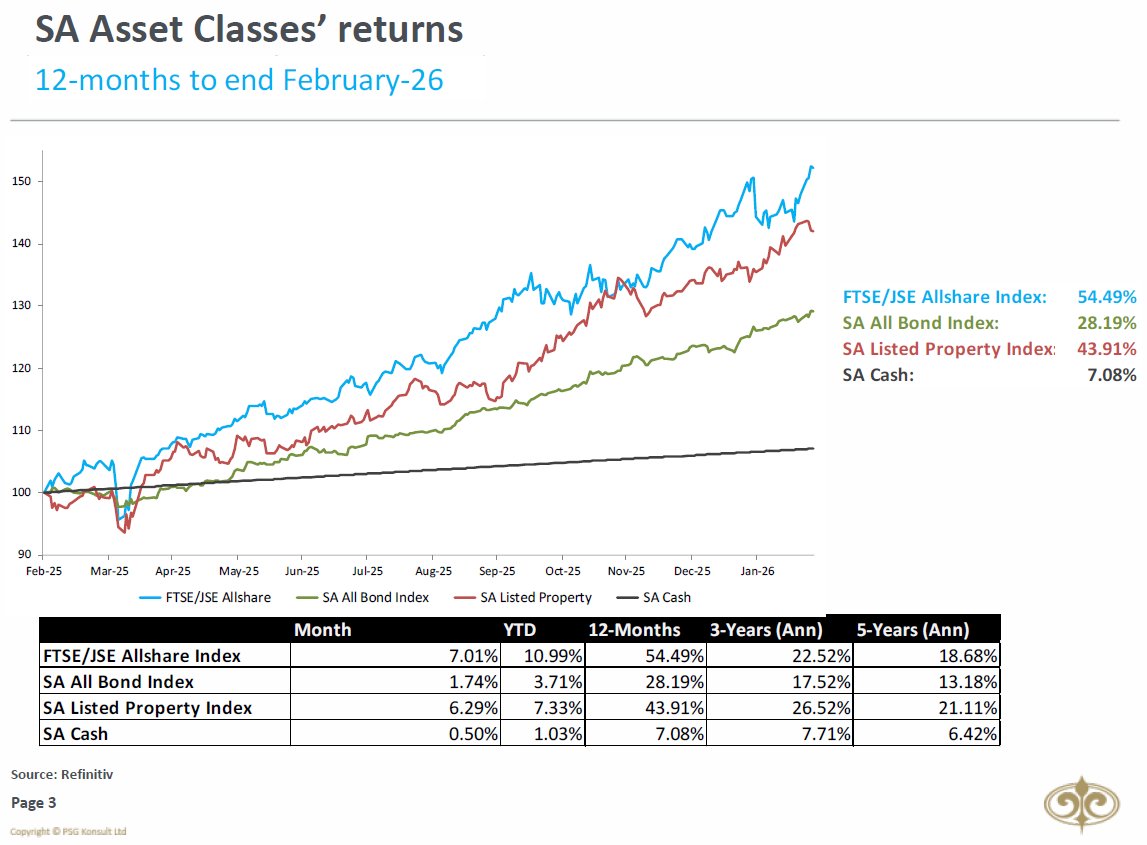
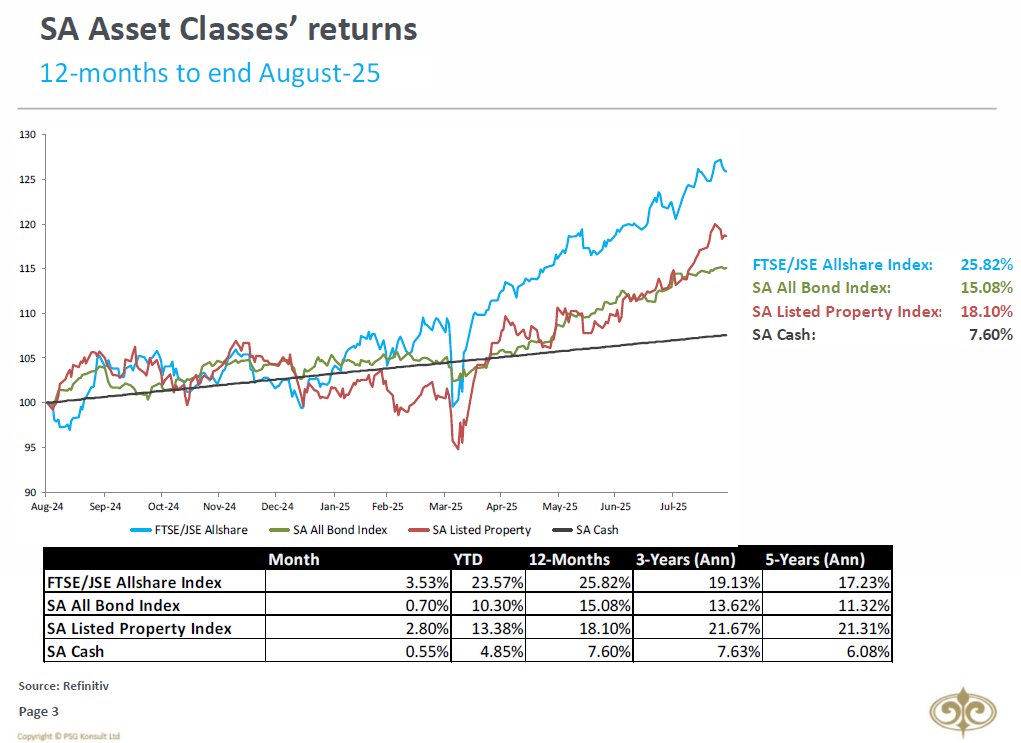
UPDATE ON MARKETS: FTSE/JSE All Share improved by another 1.6% during May, bringing the year-to-date returns to 16.02%. SA Property stocks took a breather after a MASSIVE recovery during April by declining by 2.9% in May. The SA All Bond Index increased by 3.7% for the period. 

2/9
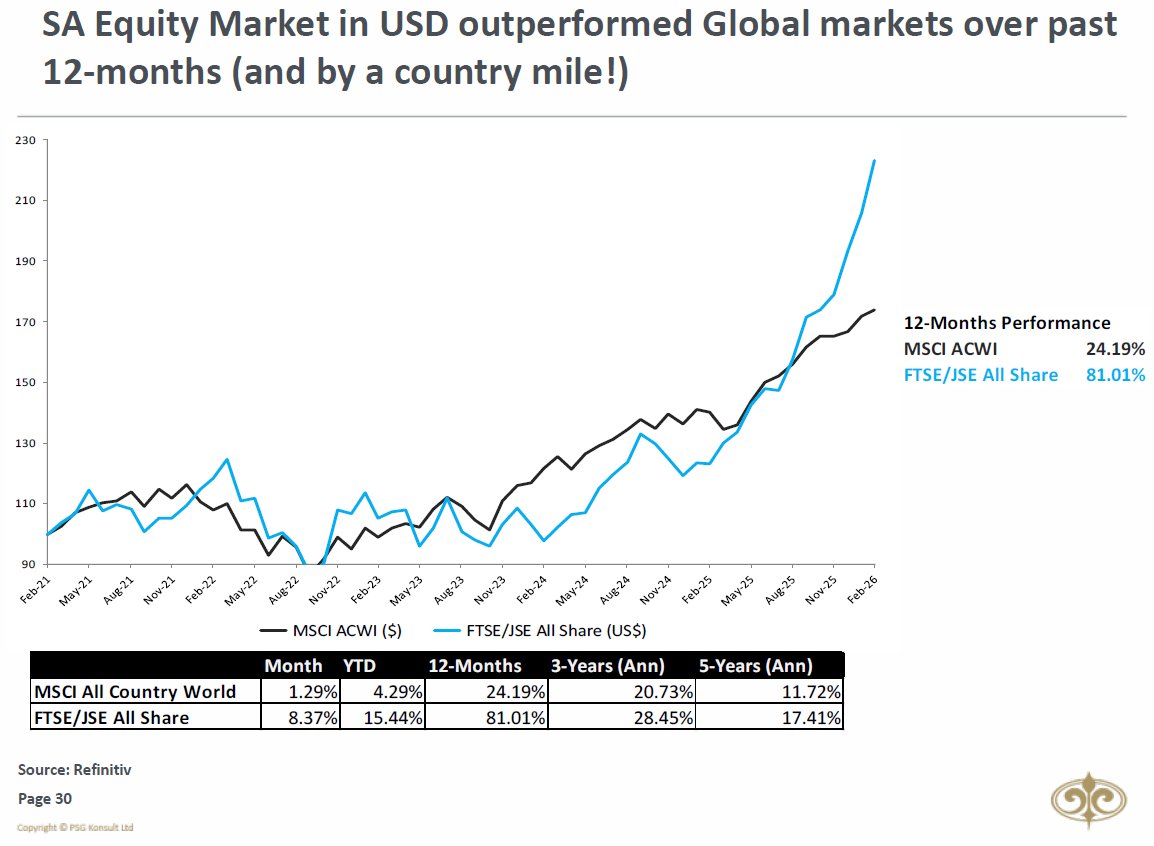
The FTSE/ JSE All Share (+7.30%) had a much stronger month than the MSCI All Country World Index (+1.56%) again in USD-terms. The 12-month performance for the JSE in USD-terms still leads the MSCI ACWI’s performance by nearly 35%.
The FTSE/ JSE All Share (+7.30%) had a much stronger month than the MSCI All Country World Index (+1.56%) again in USD-terms. The 12-month performance for the JSE in USD-terms still leads the MSCI ACWI’s performance by nearly 35%.

3/9
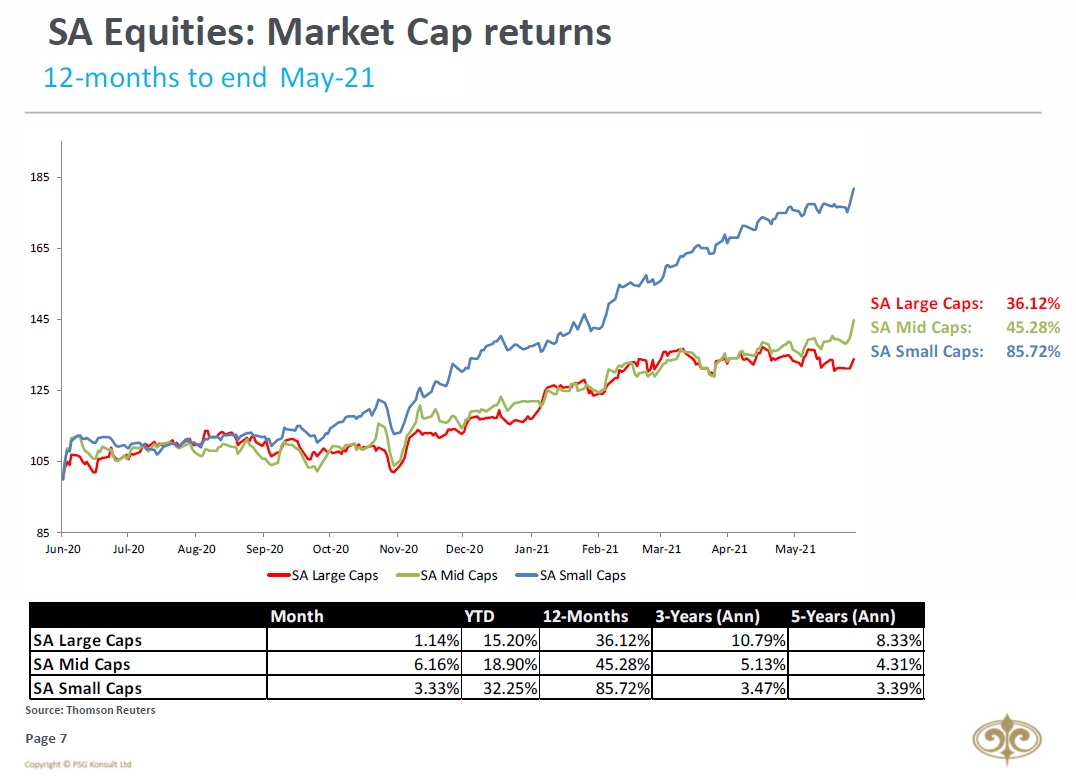
South African Mid-Caps dominated during May, growing by 6.16%. Large Caps and Small-Caps grew by 1.14% and 3.33% respectively.
South African Mid-Caps dominated during May, growing by 6.16%. Large Caps and Small-Caps grew by 1.14% and 3.33% respectively.
4/9
Foreigners were net sellers of South African Equities in May, however, they were net buyers of local bonds.
Foreigners were net sellers of South African Equities in May, however, they were net buyers of local bonds.

5/9
From a sectoral point of view, May saw Financials dominating other sectors. Resources took a bit of a breather. Naspers/Prosus was the biggest loser again in terms of attribution (compared to Capped Swix). We also saw Industrials lagging behind market performance yet again.
From a sectoral point of view, May saw Financials dominating other sectors. Resources took a bit of a breather. Naspers/Prosus was the biggest loser again in terms of attribution (compared to Capped Swix). We also saw Industrials lagging behind market performance yet again.


6/9
Rand’s value strengthened by a whopping 5.7% against the USD again, by 3.8% against the Euro & 2.6% against the British Pound. Rand had another great performance month against the other BRICS currency movements and kept its lead in terms of performance over a 5-year period.
Rand’s value strengthened by a whopping 5.7% against the USD again, by 3.8% against the Euro & 2.6% against the British Pound. Rand had another great performance month against the other BRICS currency movements and kept its lead in terms of performance over a 5-year period.

7/9
The US M2 Money Supply YoY growth rate was north of 20% again, putting some pressure on the US Dollar and helping Gold.
The US M2 Money Supply YoY growth rate was north of 20% again, putting some pressure on the US Dollar and helping Gold.

8/9
The US Dollar Index weakened in May and remained below both its 200-day and 50-day Moving Averages.
$DXY
The US Dollar Index weakened in May and remained below both its 200-day and 50-day Moving Averages.
$DXY

9/9 & Final
Most commodities had a mixed month during May. Gold increased by 7.8%, while Brent increased by 3.5%. Palladium dropped from its all-time highs in April, and decreased by 5.5% during May.
Most commodities had a mixed month during May. Gold increased by 7.8%, while Brent increased by 3.5%. Palladium dropped from its all-time highs in April, and decreased by 5.5% during May.

Unroll @threadreaderapp
• • •
Missing some Tweet in this thread? You can try to
force a refresh