Some notes:
• Remember, antibody neutralisation is not the same as vaccine efficacy. 5.8-fold reduction in the former does not mean the same thing for the latter
• This paper shows a 2.2-fold reduction in neutralisation for Delta relative to Alpha (5.9 / 2.6). PHE data so far points to a ~10% drop in VE for Delta vs Alpha after two doses of Pfizer, so you can see how the two numbers are on very different scales
• The authors include a very helpful plot (adapted from nature.com/articles/s4159…) showing how the relationship between the two metrics varies at different levels. The concern is that as neutralisation falls (moving left), the corresponding drop in VE rises (curve gets steeper)
• In other words, the same erosion of antibody neutralisation (due to age, time since jab etc), is likely to produce a larger drop in VE for an already-evasive variant than for a less evasive one
• This may strengthen the argument for booster jabs, for example
• Finally: for UK and other countries where Alpha has been dominant throughout vaccination period, it's the relative comparison between Delta & Alpha, not Delta & wild-type, that's the key one to focus on in terms of how it shifts the results we've experienced in recent months
• • •
Missing some Tweet in this thread? You can try to
force a refresh
A side note: I’ve seen it said that the media is putting a positive spin on things despite SAGE members and other experts being much more worried.
This is a surprise to me, since the people we speak to for our reporting and quote in our articles are SAGE members and experts 🤔
We probably spent 20+ hours each reporting these stories, running well into Friday night and Saturday. This involved speaking to experts in immunology, epidemiology and broader public health, including the very people who did the analysis on vaccine efficacy and transmissibility.
I get why some think there’s not sufficient alarm. 150k have died in the UK, and a reluctance to act early has played a part.
But to accuse us of spinning when we’re working our asses off to get data & expert comment to the public as quickly as possible, is quite something.
Lots of questions still bouncing around on vaccine efficacy vs B.1.617.2, so here are some follow-ups to our Saturday morning story:
Thread follows, and @SarahNev and I published a new story last night covering all the details including transmissibility: ft.com/content/e71471…
Following our original story, PHE later published more detailed data disaggregated by vaccine.
That data shows our pooled figure of 7% relative drop in two-dose efficacy against B.1.617.2 vs B.1.1.7 comprised a 6% drop for Pfizer, 10% drop for AstraZeneca. Very little difference
Similarly, the 35% relative drop in efficacy after one dose was virtually indistinguishable between the two vaccines.
I would ask people to read what follows carefully. Vaccine efficacy is a nuanced topic and the numbers here need to be interpreted in their proper context.
The data, which the FT has seen, suggest first dose offers around 35% less protection against symptomatic infection with B.1.617.2 compared to B.1.1.7, but after two doses the relative drop is only 7%.
The figures are based on pooled data from the Pfizer and AstraZeneca vaccines
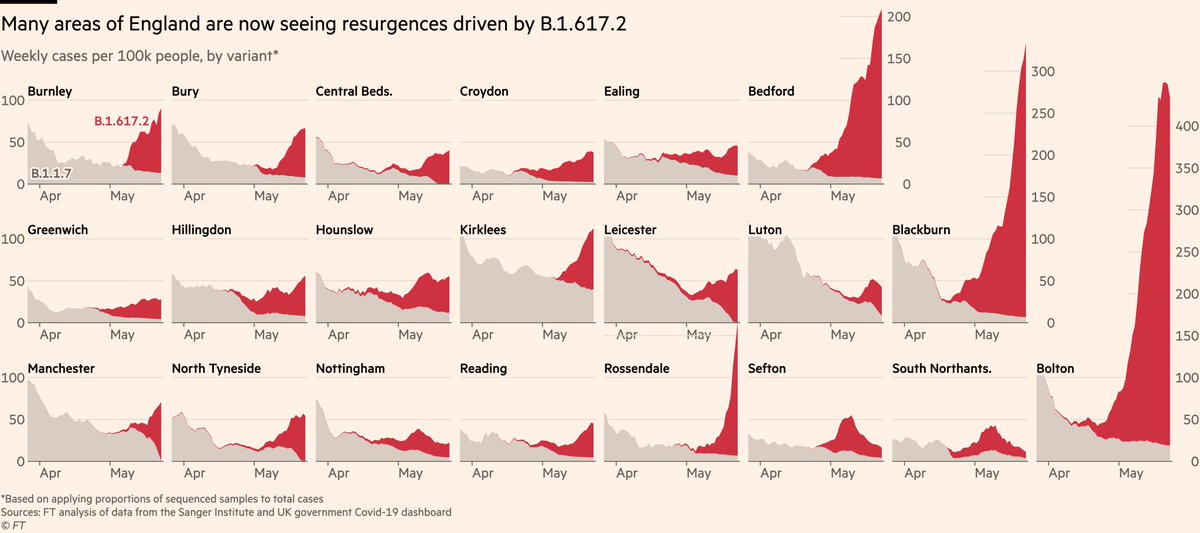
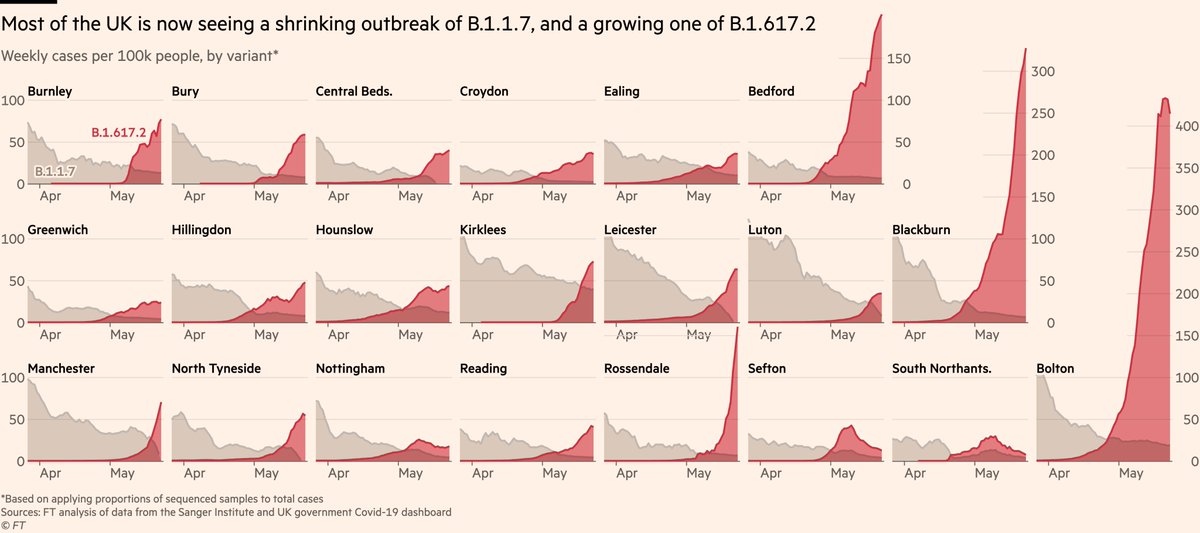
Cases continue to climb in Bolton, Blackburn & Bedford, (known B.1.617.2 hotspots), though rate of acceleration in Bolton has slowed slightly, and test positivity there is flat, suggesting surge testing is playing a role in 📈
Continued increase in those areas would be a concern, and it’s worth noting rises in neighbouring Bury and Burnley too.
B.1.617.2 not believed to be dominant in either of these areas, but Sanger data is now 12 days old so that may have changed.
Nonetheless, the same chart shows that high prevalence of B.1.617.2 is by no means a guarantee of prolonged resurgence.
Hounslow, Nottingham and Sefton are all places where B.1.617.2 is believed to be dominant, and yet their upticks reversed and now appear as brief blips.
First, today’s Sanger data on variants at local level. On the surface, this doesn’t look good. Cases of non-B.1.617.2 are in decline, but those red peaks are the variant sending overall rates climbing
To state the obvious: that pattern is not what we want to see, and if things keep going in that direction, we could see national cases rapidly climb again.
But there are a couple of reasons to pause before assuming we’re going to see those peaks steepen and proliferate.
First, the Sanger data is sequences with specimen date before May 8.
We’ve got more days of data since then. It’s not broken down by variant, but it can show us what’s happened to total cases in those areas since May 8.
Answer: growth rates have slowed, in some cases reversed