Mortality in Canada (thread):
Here we have the total number of deaths in Canada and its regions over the past ten years.
Here we have the total number of deaths in Canada and its regions over the past ten years.

Here we have the same chart you saw above now expressed as a rate per 100,000 people. Generally, a flatter trend in death rates would suggest that population growth may be a key factor driving growth in total deaths.

Looking at the past decade nationally, we see that it's natural for deaths in one year to exceed deaths in the previous year (blue line > 0%). Note that a year of low or negative growth is often followed by a year of much higher growth.

Again, we see that when we adjust for population growth, the growth trend is weaker but still there - the aging of the population is a primary factor. Deaths are rising in absolute and relative terms, suggesting a combo of population growth and aging.

Canada total weekly deaths Jan. 2010-Feb. 2021.

Here are deaths and death rates since 1900. Note how the death rate bottomed out in the early 1980s and has been rising steadily since, accelerating when the Baby Boomers started to reach their 70s in 2016.

Here are leading causes of death in Canada over the past 5 years.
Many recent deaths remain unclassified in the "information unavailable" column and will presumably will properly attributed over time.
Many recent deaths remain unclassified in the "information unavailable" column and will presumably will properly attributed over time.

Here is the same, presented as rates per 100,000 population to account for population growth.
A key question to address as this data evolves is the degree to which deaths attributed to covid-19 have substituted for deaths attributed to other causes.
A key question to address as this data evolves is the degree to which deaths attributed to covid-19 have substituted for deaths attributed to other causes.
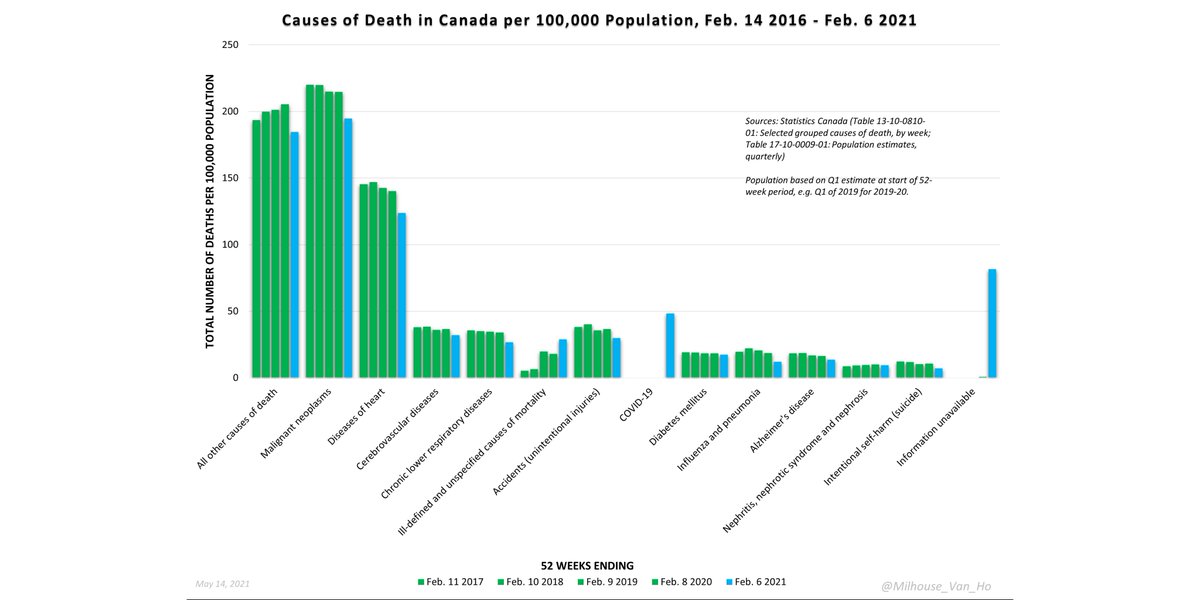
Part of the increase in death in 2020 can be explained by the response to the pandemic (i.e., lockdown), rather than covid-19 itself.
www150.statcan.gc.ca/n1/daily-quoti…
www150.statcan.gc.ca/n1/daily-quoti…

Note also that Covid-19 is often not a wholly distinct and separate cause of death as there are other medical conditions involved in many cases.
There are also cases in which it is not even a cause of death, but the individual had tested positive sometime prior to their death.
There are also cases in which it is not even a cause of death, but the individual had tested positive sometime prior to their death.

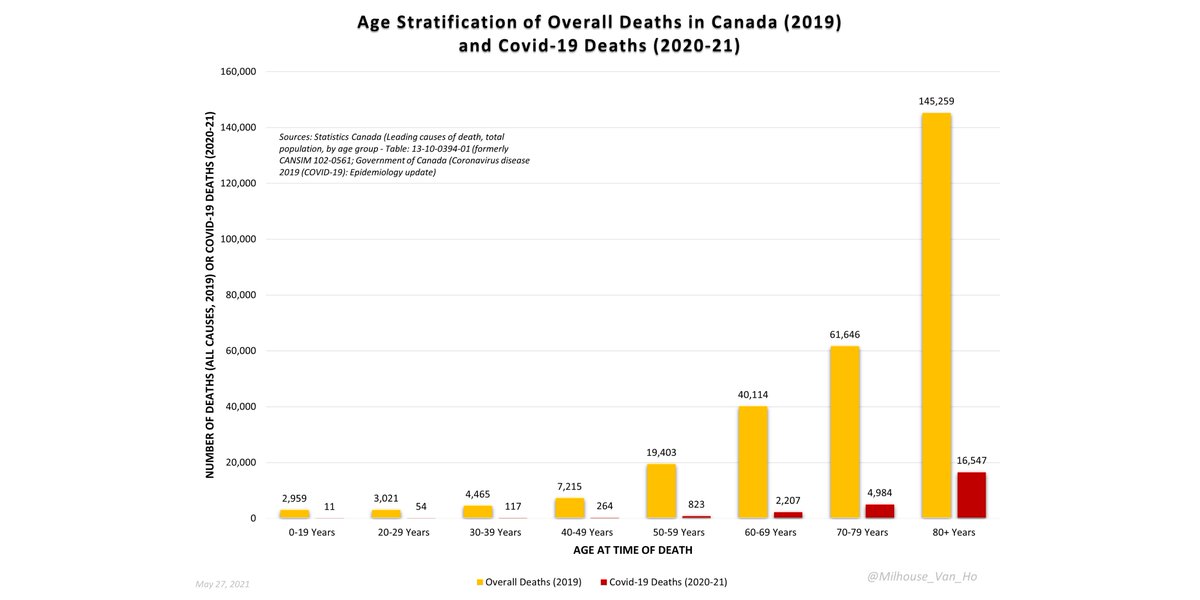
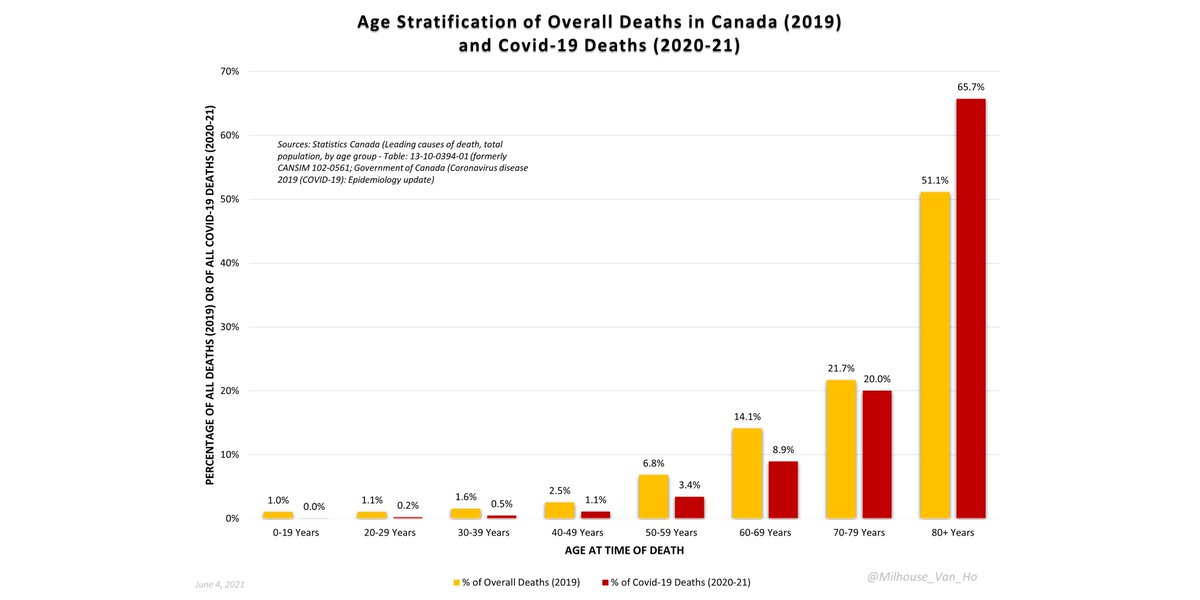
The number of deaths from all causes in 2019 vs. number of deaths from or with Covid-19 in 2020-21.

The average age of a death by or with covid-19 is higher than life expectancy.
Deaths among those over 80 account for 66% of deaths by/with covid-19, but only 51% of all deaths (all causes) in 2019.
Deaths among those over 80 account for 66% of deaths by/with covid-19, but only 51% of all deaths (all causes) in 2019.
The 70+ age cohort accounts for only 12% of the population but 73% of all-cause deaths in Canada and 86% of deaths from or with Covid-19.
In contrast, children account for 22% of the pop. but only 1% of all-cause deaths in Canada and 0% (0.04%) of deaths from or with Covid-19.
In contrast, children account for 22% of the pop. but only 1% of all-cause deaths in Canada and 0% (0.04%) of deaths from or with Covid-19.

Among >80 in Canada, there were 8,939 deaths of all causes in 2019 and 1,024 deaths from or with Covid-19 per 100,000 people in 2020-21.
Among children, there were 36 deaths of all causes in 2019 and 0 (0.1) deaths from or with Covid-19 per 100,000 people in 2020-21.
Among children, there were 36 deaths of all causes in 2019 and 0 (0.1) deaths from or with Covid-19 per 100,000 people in 2020-21.

Canada – Case survival rates (= 100% - case fatality rate) by age.
(True survival rates based on IFR would be significantly higher.)
(True survival rates based on IFR would be significantly higher.)

Sources:
www150.statcan.gc.ca/t1/tbl1/en/cv.…
www150.statcan.gc.ca/t1/tbl1/en/tv.…
www150.statcan.gc.ca/t1/tbl1/en/tv.…
health-infobase.canada.ca/covid-19/epide…
en.wikipedia.org/wiki/Demograph…
www150.statcan.gc.ca/n1/daily-quoti…
www150.statcan.gc.ca/t1/tbl1/en/cv.…
www150.statcan.gc.ca/t1/tbl1/en/tv.…
www150.statcan.gc.ca/t1/tbl1/en/tv.…
health-infobase.canada.ca/covid-19/epide…
en.wikipedia.org/wiki/Demograph…
www150.statcan.gc.ca/n1/daily-quoti…
• • •
Missing some Tweet in this thread? You can try to
force a refresh