How to forecast inflation? Four approaches, different answers from each:

1. Micro: component-by-component
2. Macro: slack
3. Macro: quantity theory
4. Macro: nominal GDP - real GDP

A 🧵 on thinking about these.
MICRO: COMPONENT-BY-COMPONENT. Some people are skilled/experienced at this, I'm not one of them. For example, might think used car prices temporarily spiked and will fall when the temporary bottleneck ends up airfares still need to rise.
This can be very useful for shorter-run forecasting but ultimately the microeconomic stories can only tell you about relative prices.

Two countries, one might have 1% average inflation and the other 10% average inflation and no micro story can distinguish them.
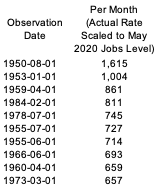
Right now the micro stories are telling us that inflation rates will come down from what we've experienced in the first five months of this year. The main reason being that a lot of the May inflation was in freakish items with huge increases that will reverse.
MACRO: SLACK. This is the main mental model I use and most of the people I engage with us. It says if some slack measure is low then some nominal measure will be high or higher or higher than expected.

Endless debates over the measure of slack, the nominal measure, magnitudes.
The slack framework is the main reason people have expected inflation to stay low. They have emphasized the flatness of the Phillips curve, that is unemployment or employment or whatever can vary a lot without much change in inflation.
Some others look at the slack framework and get worried:

--The curve may unflatten if expectations unanchor
--NAIRU temporarily high so no slack
--Openings a better RHS variable so no slack
--Ray Fair's use of the inverse unemployment rate

cowles.yale.edu/sites/default/…
But on balance I would say the slack framework mostly says not much additional inflation but it still leaves from for debate.
MACRO: QUANTITY THEORY. This is not a framework I use or most anyone I engage with uses. It says inflation will be related to the growth of some monetary aggregate. For example, M2 is up 15-20% so inflation should be up about that amount too.
Most economists place little weight on this model because it has worked terribly in the past. I expect it to be just as useless this year. But if inflation is above 10% this year I promise to travel to each of the quantity theory adherents in person to apologize to them.
MACRO: NOMINAL GDP - REAL GDP. This isn't a particularly standard approach, in a normal year I wouldn't recommend it, but at the current moment with so many other relationships out of whack I find it a useful perspective.
The "theory" is simply that if you can forecast nominal GDP growth and real GDP growth you can just subtract to get price growth (GDP prices, but close enough).

That is true by definition but is it useful?
You can make it useful by trying to forecast. Nominal demand is related to variables like incomes and interest rates. With nominal disposable personal income for 2021 likely ~15% higher than in 2019 and interest rates low likely demand in 2021-Q4 above pre-pandemic trends.
Real GDP = hours worked * output/hour.

The former looks like it will be below trend at the end of this year. The later is a huge wildcard (more on that in another thread in the future). But overall put this at pre-pandemic trend by 2021-Q4.
You can debate the inputs the nominal/real GDP forecast framework but generally this mentality leads you to inflation forecasts like 3% or 4% and possibly even higher in 2021 and 2022.
CONCLUSION. Ex post all of these frameworks can be made correct. The question is how useful are they ex ante. They can all be implemented in different ways but to overgeneralize would say that I'm finding the nominal GDP - real GDP the most useful mental crutch right now.

• • •

Missing some Tweet in this thread? You can try to force a refresh
 

Keep Current with Jason Furman

Jason Furman Profile picture

Stay in touch and get notified when new unrolls are available from this author!

Read all threads

This Thread may be Removed Anytime!

PDF

Twitter may remove this content at anytime! Save it as PDF for later use!

Try unrolling a thread yourself!

how to unroll video
  1. Follow @ThreadReaderApp to mention us!

  2. From a Twitter thread mention us with a keyword "unroll"
@threadreaderapp unroll

Practice here first or read more on our help page!

More from @jasonfurman

10 Jun
We have had more inflation in the first 5 months of this year than most forecasters expected for the full year. How should we revise our forecasts? Not obvious:

1. Expect less (or even negative) inflation going forward.

2. Only getting started (expect more going forward).

A 🧵
FIRST VIEW is based on mean reversion. A lot of the inflation we have seen is in specific categories like vehicles, travel and restaurants. Some of those increases could reverse and others could level off. This is a striking illustration of that.
Going for this view is the fact that I believe there is a very likely case for substantially faster job growth going forward so the supply-side of the economy could start catching up with the demand side.
Read 11 tweets
10 Jun
Nominal wages are about 0.9% above their pre-pandemic trend. BUT prices are about 1.4% above their pre-pandemic trend. So as of May real wages were down--with the notable exceptions of financial activities and leisure and hospitality.

(Caveat: some data kludge, see below.) Image
This is as of May, could easily change, potentially by a lot in coming months, depending on what happens to nominal wages and nominal prices.

Hopeful story: there is more of a story of mean reversion in prices (i.e., many *way* above normal and will come down) than in wages.
The data kludge caveat: the average hourly earnings data is seriously distorted by composition effects (low wage workers not back). The ECI data adjusts for this composition but only goes through March. So I used ECI through March and AHE to extend to May. Introduces some error.
Read 4 tweets
9 Jun
My thinking:

1. People's 90% confidence intervals are systematically too small (as in, stuff happens outside them more than 90% of the time).

2. Especially true of economic forecasters (how many jobs numbers in the last 15 months were outside your 90% confidence interval?)
3. This year two types of uncertainty are much larger than usual: (a) the virus could mutate and escape the vaccine and (b) our combination of positive demand and supply shocks plus reallocation is way out of our sample.
As for the numbers, I would think a 5%+ chance we have mandatory social distancing in December. Last time around prices fell 0.8% in a two month period. Plus add in all of the other randomness and unforeseeable events.
Read 5 tweets
8 Jun
The speed limit view of job creation is greatly overstated. Here are the fastest periods of six-month job growth in the United States since 1950 (scaled to today's job level)

We can and likely will do much better than 500K or 600K per month.

Slightly more nuanced 🧵follows. Image
These examples are a long time ago but I would argue conditions are better for job creation now than ever before:

--Huge stimulus

--Highest opening rate ever recorded

--A large number of unemployed

--People getting vaccinated, COVID coming down, policy restraints ending.
Moreover, the rate of people finding jobs is notably low right now as @p_ganong points out. If it was just normal we would be adding an extra 500,000 jobs a month give or take.

Read 11 tweets
8 Jun
Another interesting but impossible to interpret question fro the IGM forum on "The current combination of US fiscal and monetary policy poses a serious risk of prolonged higher inflation."

What is "serious risk" and "prolonged higher inflation"?

igmchicago.org/surveys/overhe…
Inflation was below the Fed's 2% target for a long time before this crisis. If it is 2% after this crisis that would be "prolonged higher inflation" but almost everyone would agree it was good. If this is what I thought should I answer yes or no to the question?
What if I think inflation will rise to 3% but that is a better rate than the 2% target? How should I answer the question?
Read 5 tweets
8 Jun
The age composition of employment changes is interesting, I haven't all my thoughts together on it so sharing while I continue to scratch my head. And any thoughts most welcome.

A short 🧵 Image
Teen employment is stunning. It is already above its pre-pandemic rate. Also:

--The unemployment rate is the lowest since the 1960s (lowest ever for Black)

--40% of the job gains in the last two months were age 16-19 (4% of the population)
Hard to be sure what it means given that these data are very noisy & disaggregating more would run into seasonal adjustment issues. But some factors may be: reduced immigration, shift to online schooling or increased time off from school, and many of them are not eligible for UI.
Read 6 tweets

Did Thread Reader help you today?

Support us! We are indie developers!


This site is made by just two indie developers on a laptop doing marketing, support and development! Read more about the story.

Become a Premium Member ($3/month or $30/year) and get exclusive features!

Become Premium

Too expensive? Make a small donation by buying us coffee ($5) or help with server cost ($10)

Donate via Paypal Become our Patreon

Thank you for your support!

Follow Us on Twitter!

:(