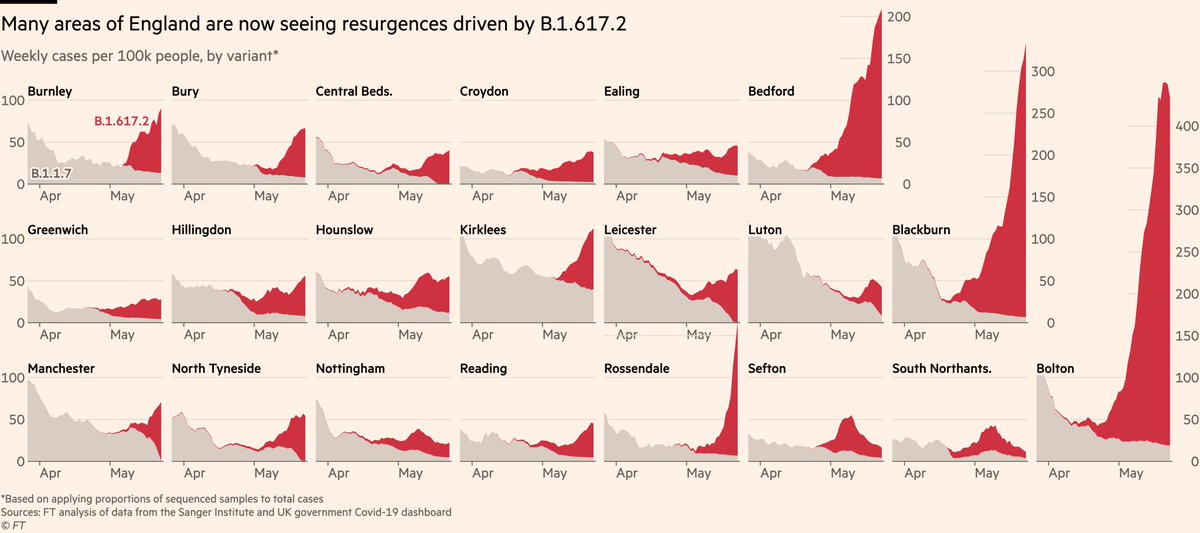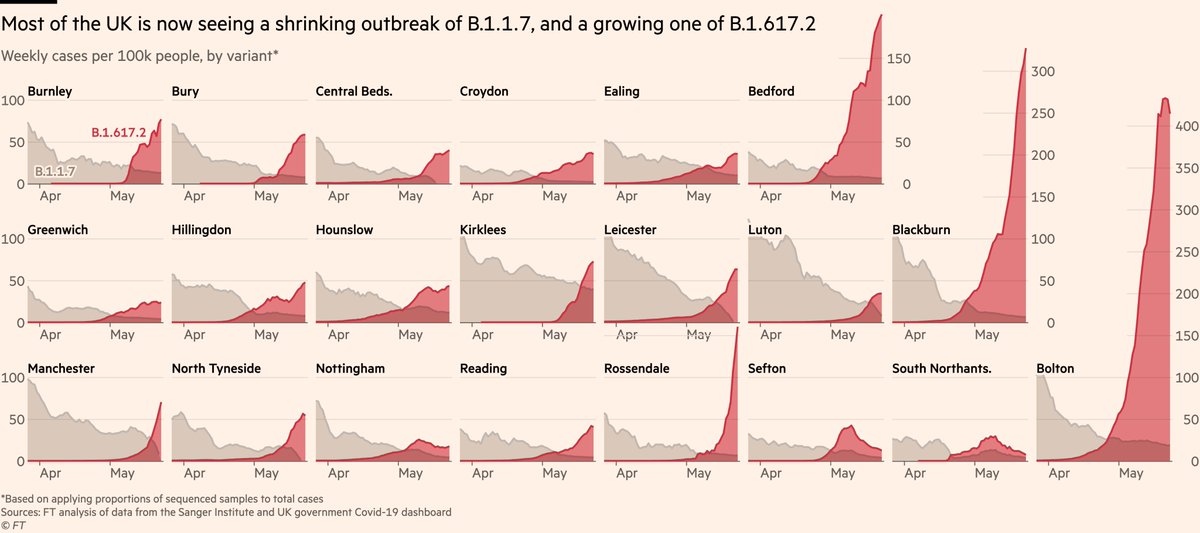
NEW: latest data now show a clear rise in hospital admissions in the UK, and numbers could climb rapidly.
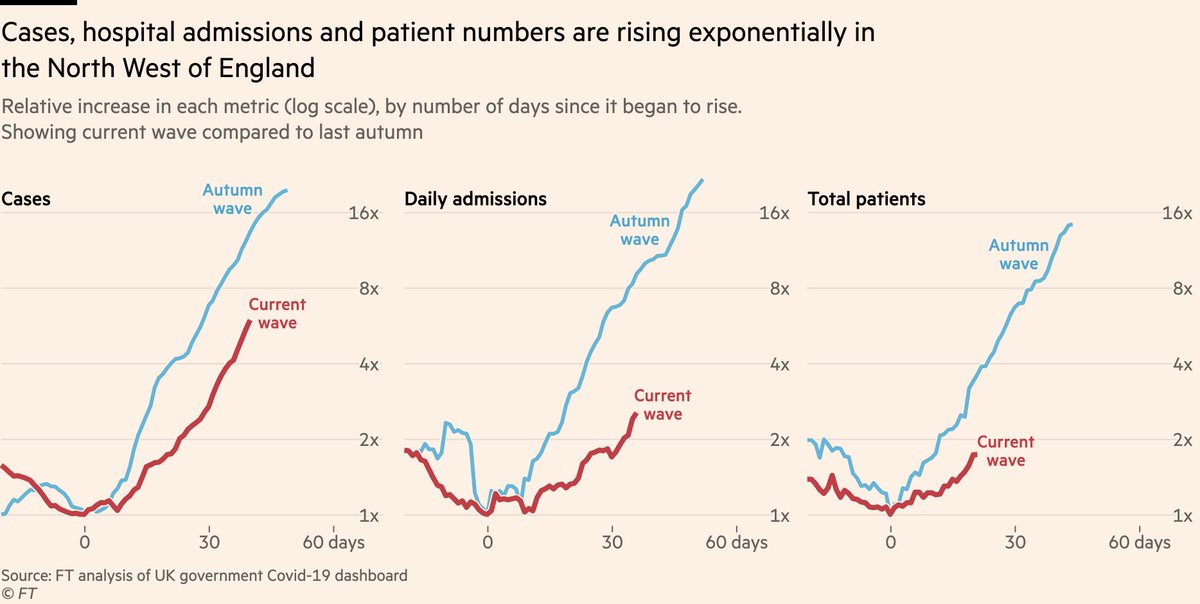
Admissions & patient numbers in the North West are ~straight lines on a log-scale: exponential growth
Our story, with @mroliverbarnes & @AndyBounds: ft.com/content/f2ae00…
Admissions & patient numbers in the North West are ~straight lines on a log-scale: exponential growth
Our story, with @mroliverbarnes & @AndyBounds: ft.com/content/f2ae00…
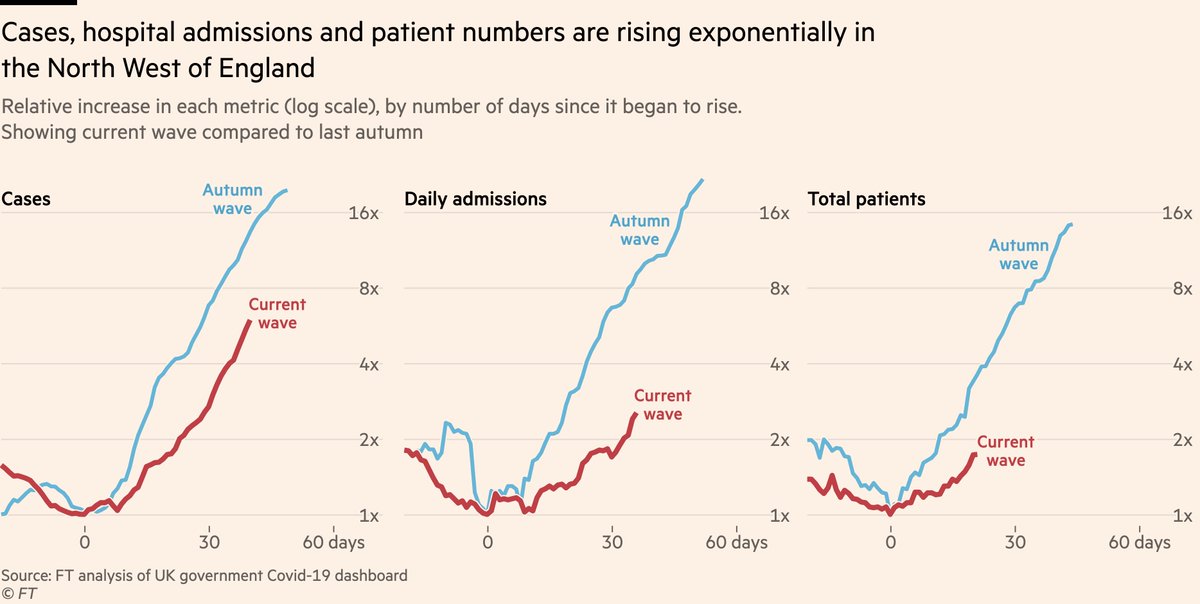
Let’s take a closer look at that chart
• Cases have been rising at a similar rate to previous waves for some time now
• What’s new is hospital admissions now undeniably following suit. In North West, admissions rose by 30% in week ending May 30th. Since then they’ve climbed 40%
• Cases have been rising at a similar rate to previous waves for some time now
• What’s new is hospital admissions now undeniably following suit. In North West, admissions rose by 30% in week ending May 30th. Since then they’ve climbed 40%
This is despite vaccines that offer good protection against hospitalisation, so what’s going on?
As ever, age breakdowns tell the story. Hospital admissions remain low and flat among mostly-double-dosed older groups, but the increase is coming among younger adults.
As ever, age breakdowns tell the story. Hospital admissions remain low and flat among mostly-double-dosed older groups, but the increase is coming among younger adults.

Again, that increase among younger adults is tracing a ~straight path on a log scale, indicative of exponential growth. Further vaccines can flatten that curve, but as @BristOliver has pointed out, the additional cases over recent days and weeks already guarantee more admissions.
And as @_nickdavies explains in our story, the problem here is that even though the most vulnerable are now protected, there are still more than enough un(der)protected people to fuel exponential growth in hospital cases for a long time yet, which could send numbers much higher.
The big question is what this could mean for deaths. So far, there has *not* been a sustained rise in mortality, including in the North West where the deaths series remains bumpy (due to very low numbers) and lower than it was a couple of months ago. 

There is good reason to believe a wave of younger cases and admissions will be a less lethal wave than those that came before vaccines, as I discussed here used age-specific-fatality rates. Nonetheless, more cases and more admissions will mean more deaths
https://twitter.com/jburnmurdoch/status/1397995420064825351
Away from the North West, all of these patterns are also apparent on the national scale if we look at England as a whole.
Admissions and patient numbers have begun arcing upwards, and there’s no reason to believe they won’t follow the North West’s trajectory.
Admissions and patient numbers have begun arcing upwards, and there’s no reason to believe they won’t follow the North West’s trajectory.

But again, this is being driven by younger admissions, so we still expect that for a given number of admissions, the number of deaths will be lower during this wave than previous ones. The link between cases, admissions and deaths is certainly not broken, but it is weaker.
One hope for this wave was that the climb in hospital admissions may be more gentle than in previous waves, making any delay in action less damaging.
But comparing the slopes of the red lines and the blue, I don’t think we can be sure the rate of increase *will* be slower.
But comparing the slopes of the red lines and the blue, I don’t think we can be sure the rate of increase *will* be slower.

However, we do have the tools available to change the slope:
• The latest data suggests that two doses of a vaccine offer very high protection against hospital admission, likely above 95%, and a single dose may also offer something in the region of 70% protection
• The latest data suggests that two doses of a vaccine offer very high protection against hospital admission, likely above 95%, and a single dose may also offer something in the region of 70% protection
• The postponement of full reopening on June 21 would also provide time for more people to be vaccinated, though as @BallouxFrancois and @JamesWard73 have noted, postponing too far risks pushing the wave into winter, where seasonality would make it much harder to deal with
Conclusions:
• Third wave of hospital admissions clearly underway
• Further reopening on June 21 would accelerate already exponential growth
• Data still suggest this wave should be less lethal
• Vaccines work very well, including against Delta. They remain our way out
• Third wave of hospital admissions clearly underway
• Further reopening on June 21 would accelerate already exponential growth
• Data still suggest this wave should be less lethal
• Vaccines work very well, including against Delta. They remain our way out
Finally a big thanks to everyone who spoke to us for this piece.
Detractors will be shocked to discover that, as usual, we spoke to more than a dozen epidemiologists, disease modellers, public health officials and hospital staff for this story.
Detractors will be shocked to discover that, as usual, we spoke to more than a dozen epidemiologists, disease modellers, public health officials and hospital staff for this story.
• • •
Missing some Tweet in this thread? You can try to
force a refresh


