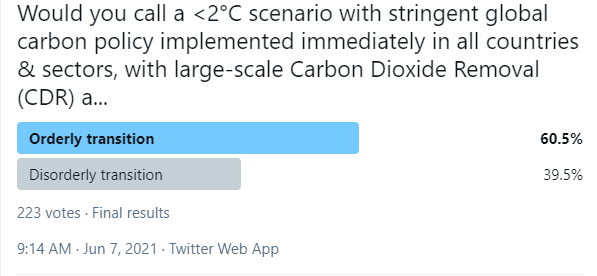
I had a poll the other day on "Orderly" versus "Disorderly" energy transitions. This wording comes from the @NGFS_.

I have troubles with saying immediate implementation of global 1.5°C climate policies is orderly. Perhaps in a model but not in reality.

A few thoughts...

1/
A global carbon price of 150 or 200$/tCO₂ in 2025 is the difference between Orderly & Disorderly? (blue versus purple). You are kidding me?

Or a delay of 10 years and then a carbon price of 250$/tCO₂ is disorderly?

2/
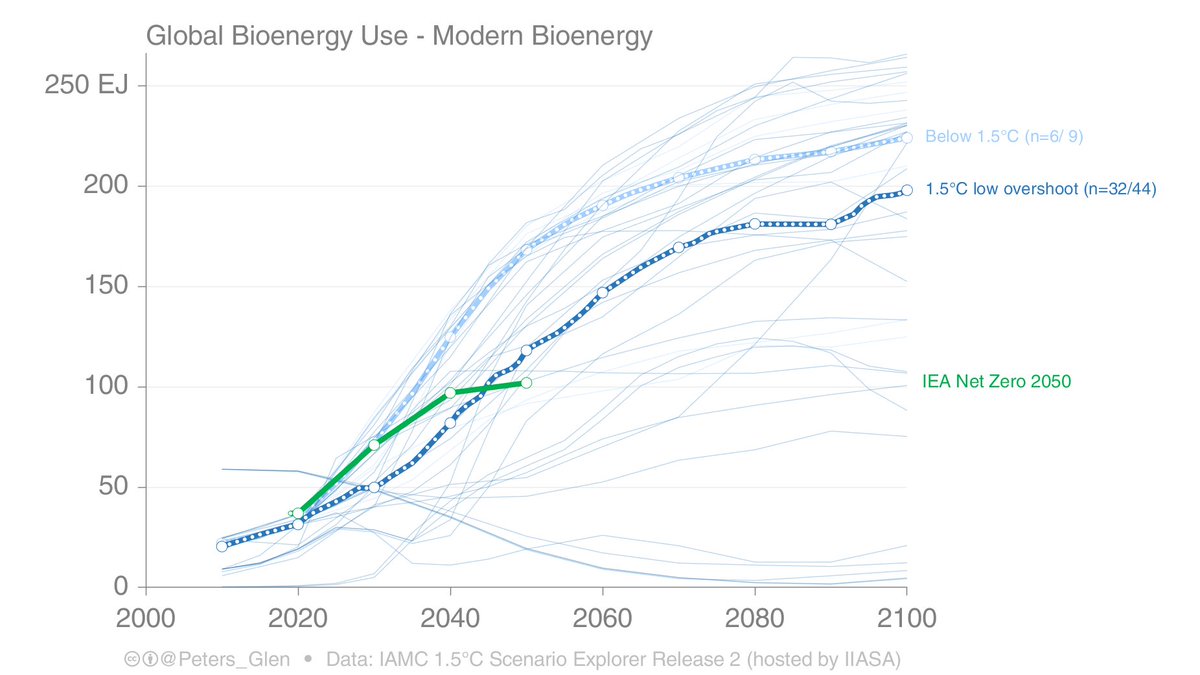
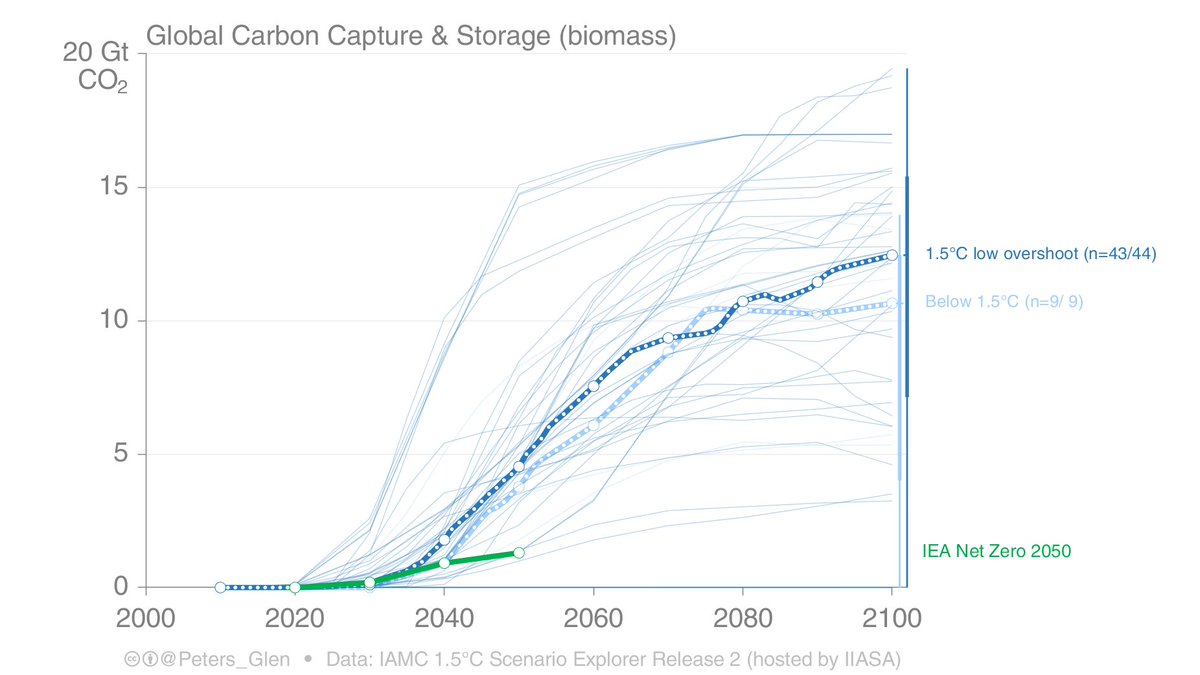
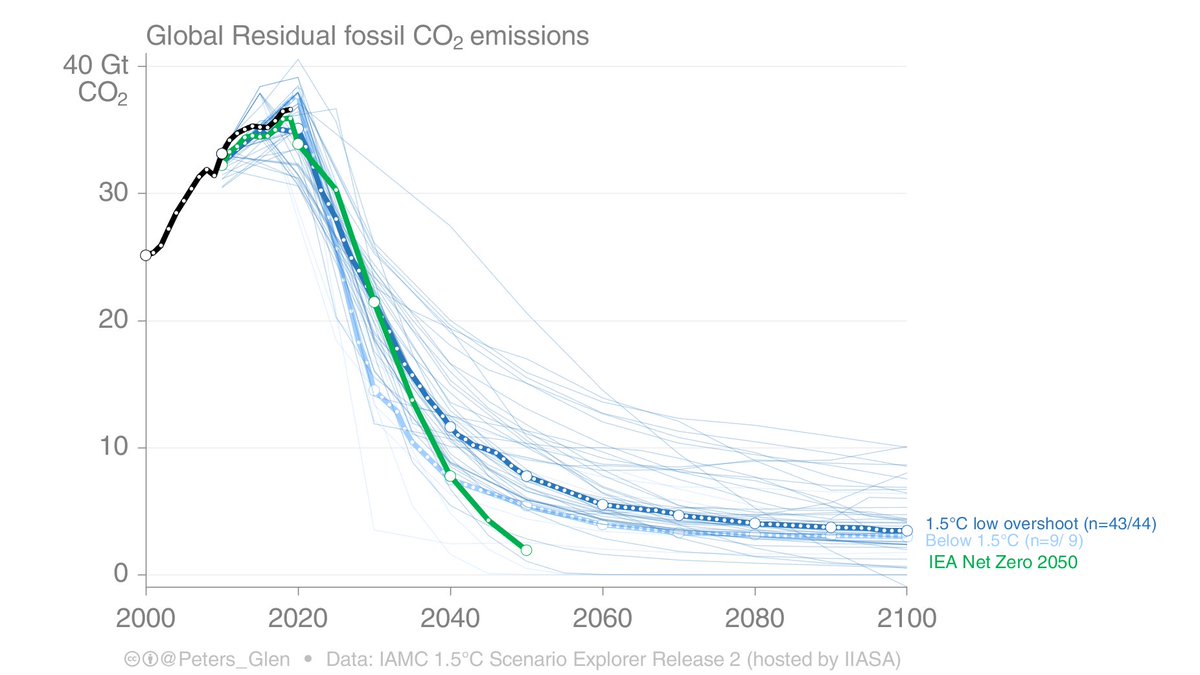
This is reduction in coal in the various NGFS mitigation scenarios.
* Which one looks orderly?
* Which country would find implementing an economy wide climate policy overnight orderly?

3/
Personally, I think the language is wrong here.

To follow any of these scenarios is going to require massive and immediate change. I do not see in any way how this is going to be orderly.

Many examples of protests or elections based on very minor climate policy.

4/
We have to call mitigation to 1.5°C or <2°C for what it is. It will be a monumental push from a diverse range of actors. Some people will be pissed, big time!

An "orderly" transition will probably mean we miss <2°C. We need disruption. I don't see how this can be avoided.

5/
Kevin Anderson @KevinClimate talks about laminar versus turbulent flow:


I agree with Kevin on the principal, but it is not how I would characterise IAMs.

I would say the changes in IAMs (or consequences of changes) are rather disruptive (turbulent?).

6/
While Kevin & I may split hairs on how to frame 1.5°C in IAMs, I think we both would agree that 1.5°C will require disruptive change.

Back to the original tweet. I have problems calling a cost-optimal 1.5°C scenarios "orderly", there is nothing orderly about 1.5°C scenarios!

7/
[Noting all IAMers will disagree with me, as they are using model speak for a globally harmonised climate policy in all regions & sectors. Keep the model speak out of communication to a broader public, I say...]

8/8

• • •

Missing some Tweet in this thread? You can try to force a refresh
 

Keep Current with Glen Peters

Glen Peters Profile picture

Stay in touch and get notified when new unrolls are available from this author!

Read all threads

This Thread may be Removed Anytime!

PDF

Twitter may remove this content at anytime! Save it as PDF for later use!

Try unrolling a thread yourself!

how to unroll video
  1. Follow @ThreadReaderApp to mention us!

  2. From a Twitter thread mention us with a keyword "unroll"
@threadreaderapp unroll

Practice here first or read more on our help page!

More from @Peters_Glen

4 Jun
How does the global average temperature increase compare to atmospheric CO₂ concentrations in the last ~100 years?

It is quite a linear relationship, with a 2.7°C increase for a doubling of CO₂ concentration.

This includes non-CO₂ effects, which approximately cancel.

1/
This tweet was inspired by a comment by @GregFlato based on this figure by @RARohde

"If you multiply by 270ppm to make it comparable to TCR & ECS, you get something we might call ‘instantaneous climate sensitivity’ (ICS) which comes out to be 2.7C"


2/
Greg mentioned it was not useful, but a discussion followed...


(try to follow the discussion on the various threads)

3/
Read 6 tweets
31 May
Global CO₂ emissions grew at 2.6%/yr in the 2000s, but this dropped to 1.0%/yr in the 2010s.

Can we see this in the atmosphere?

If emissions growth continued at 2.6%/yr in the 2010s, it would lead to ~0.3ppm difference in 2019, or cumulatively 1.3ppm over the 2010s.

1/ Image
How did I do this?
1. Assume emissions continued at 2.6%/yr from 2010
2. Get difference with current emissions
3. Multiply by airbourne fraction (AF, estimated 1960-2010, 0.43) to estimate atmospheric increase
4. Convert to ppm (1ppm = 2.124GtC, GtCO2 = 3.664 GtC).

Simple!

2/
We should see this in the atmosphere, but how confidently given variability?

The effective difference in growth rates is ~2%, which we should be able to detect after 5-10 years. Though, note in the commentary, we compared 1% & -1%, not 2.5% & 1%.
rdcu.be/buifD

3/
Read 4 tweets
28 May
Norway's oil industry on defensive after IEA report as polls loom

One report can change the debate & potentially tip the scales in an election year!

A good summary of why the @IEA's Net Zero 2050 report could be transformational, by @olehelgesen7.

1/

upstreamonline.com/opinion/opinio…
"It is not obvious that the cheapest resources with the lowest carbon footprint lie in the resources already discovered... To stop exploration at this time would cause a major threat to the world's energy security", are the arguments from the Norwegian Oil & Gas lobby

2/
"Recent polls have shown that 60% to 70% of voters continue to support future Norwegian oil & gas production"

[Perhaps the political niche is threading the needle between investment for old & new fields, taking the IEA's lead]

3/
Read 8 tweets
25 May
THREAD: Bioenergy use in the @IEA Net Zero 2050 scenario

I have seen a few comments that the IEA uses loads of bioenergy. Let's have a look...

First up, overall, bioenergy use is lower than in equivalent scenarios assessed by the IPCC, particularly in 2050.

1/
2. An important detail is that the IEA assumes traditional biomass is gone by 2030. Traditional bioenergy "is unsustainable, inefficient & polluting, & was linked to 2.5 million premature deaths in 2020"

The IPCC only has a slow drop, so the IEA must build up modern bioenergy.
3. In terms of modern bioenergy, the IEA has similar levels as the IPCC up until 2050.
* Rapid growth to 2030 is to compensate traditional bioenergy
* Slowdown to 2050 is to limit to 100EJ per year, view by many as sustainable.
Read 11 tweets
19 May
The IEA Net Zero 2050 scenario uses quite a lot less Bioenergy with Carbon Capture & Storage (BECCS) than scenarios assessed by the IPCC.

Consequently, all else equal, the IEA NZE2050 uses less fossil fuel in 2050 than most IPCC SR15 scenarios.

1/

iea.org/reports/net-ze…
The IEA, in contrast, has a decent (not huge) amount of Direct Air Capture (DACCS) of 0.6GtCO₂/yr.

Not many scenarios assessed by the IPCC SR15 use DACCS (4 out of 53 have non-zero data, the other 2 marked have zero DACCS)

The scenario with high DACCS is from MERGE-ETL.

2/
Since IEA NZE2050 reaches net-zero CO₂ emissions in 2050, the removals (tweets 1 & 2) must balance with (residual) emissions in 2050.

The NZE2050 clearly has far less fossil fuel use in 2050 than most IPCC SR15 assessed 1.5°C scenarios.

3/
Read 7 tweets
18 May
The new @IEA Net Zero by 2050 report is crystal clear on what is needed.

"All the technologies needed to achieve the necessary deep cuts in global emissions by 2030 already exist, & the policies that can drive their deployment are already proven."

iea.org/reports/net-ze…

1/
"Clean energy innovation must accelerate rapidly, with governments putting R&D, demonstration and deployment at the core of energy and climate policy."

In 2030 only existing technologies needed, by 2050 new technologies also come to market.

2/
Net Zero 2050 is a jobs bonanza.

JOBS. JOBS. JOBS.

"The transition to net zero brings substantial new opportunities for employment, with 14 million jobs created by 2030 in our pathway thanks to new activities and investment in clean energy"

More jobs than losses...

3/
Read 10 tweets

Did Thread Reader help you today?

Support us! We are indie developers!


This site is made by just two indie developers on a laptop doing marketing, support and development! Read more about the story.

Become a Premium Member ($3/month or $30/year) and get exclusive features!

Become Premium

Too expensive? Make a small donation by buying us coffee ($5) or help with server cost ($10)

Donate via Paypal Become our Patreon

Thank you for your support!

Follow Us on Twitter!

:(