As you can imagine, I’ve been trying for the last few days to work out what’s going on in the case data, and why it is that our models haven’t predicted the take-off in cases over the last week. I think I’m starting to get my head around it, but it’s a work-in-progress. 1/n
In essence I think we’re still thinking too much in terms of national averages, and not quite recognising that this is a wave composed of a number of local/regional outbreaks, which are concentrated in specific age groups. This has a number of implications for modelling. 2/n
In particular I want to focus on the age-group dynamic, because I think this has been under-recognised, and has led to a couple of specific problems with the models. Let’s take a quick look at the growth rate by age group in the most recent case data: 3/n 

This chart shows a sort of pseudo-R for each 5-year age group. We can see the very fast growth in the 20-30s, with a doubling time of 5-7 days (R getting close to 2). Looking at the raw data for the 20-24s makes the recent growth appear even more dramatic: 4/n

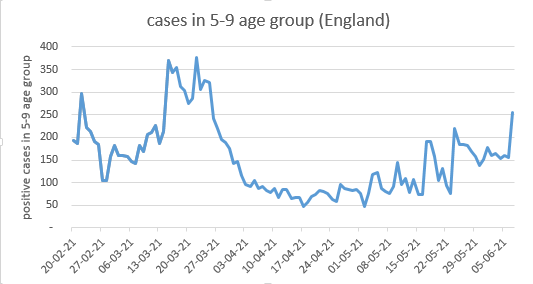
Meanwhile the growth in school-age children has taken a short break over half term (due in part to reduced testing, and also hopefully to reduced infections), but looks ready to increase again, with a spike of new cases in the last few days: 5/n
This got me thinking. And to explain my thinking I’d like to borrow @BristOliver’s analogy of the cities of Novaxia and Bigpharmia, and the hats. If you’re not familiar with this, it’s essential reading (and well worth a refresher if you are): 6/n
https://twitter.com/BristOliver/status/1356150658337009666?s=20
Now let’s imagine that the population of Bigpharmia is composed of two tribes: the Overs and the Unders. The Overs are at higher risk from the disease, and have managed to ensure that they have first claim on the magic hats – in fact most of them have got two hats already. 7/n
The Unders, by contrast, mostly haven’t been offered a hat at all yet. Thankfully, they’re also at less risk from the disease, but have put up with all sorts of restrictions on their daily lives over the last year, mostly for the benefit of protecting the Overs from dying. 8/n
Now the King of Bigpharmia has announced that, with disease rates relatively low, and with the (vulnerable) Overs nearly all having at least one hat, it’s time to get back to normal life. And in particular he has re-opened the pubs, taverns and ale-houses for indoor service. 9/n
Before doing this, the wizards and sages of BigPharmia advised the King that this would probably be OK, because on average there’s a lot of hats around that will stop the disease from spreading, and not that many people go to ale-houses each day so the impact will be small. 10/n
Unfortunately, this advice failed to take account of some important differences between Overs and Unders
1) Nearly all the hats are in the possession of Overs; very few Unders have a hat
2) Unders are a more sociable tribe than Overs – they tend to meet up with more people 11/n
1) Nearly all the hats are in the possession of Overs; very few Unders have a hat
2) Unders are a more sociable tribe than Overs – they tend to meet up with more people 11/n
...and specifically they like meeting up *with other Unders*. So most of the people they meet don’t have a hat either.
3) Unders also *love* going to ale-houses. So while the average impact across the whole population of opening up the ale-houses might be small, 12/n
3) Unders also *love* going to ale-houses. So while the average impact across the whole population of opening up the ale-houses might be small, 12/n
if we look at the impact just on Unders, it’s much larger.
4) Unders are a generally responsible crowd, and they’ve put up with a lot over the last year, mostly for the benefit of Overs. But some of the more boisterous Unders may have taken the opening of the ale-houses 13/n
4) Unders are a generally responsible crowd, and they’ve put up with a lot over the last year, mostly for the benefit of Overs. But some of the more boisterous Unders may have taken the opening of the ale-houses 13/n
...as a bit of a signal that life should return to normal in other ways. And, being at low risk from the disease themselves, they may not always be strictly following all the other rules that the King has still in force to control the spread of the disease. 14/n
All of that might have been fine were it not for the fact that, in the very same week that the ale-houses were opened, a new form of the disease arrived from Novaxia, which spread faster than the old disease and made people more likely to need treatment by the leech doctor. 15/n
I think you know what happened next. The new disease quickly spread amongst the Unders, who were:
-Mostly hatless
-Highly sociable with other hatless Unders
-Making good use of the newly-reopened ale-houses
-Not always staying two sword-lengths away from each other. 16/n
-Mostly hatless
-Highly sociable with other hatless Unders
-Making good use of the newly-reopened ale-houses
-Not always staying two sword-lengths away from each other. 16/n
The wizards and sages were slightly perplexed by this, because they hadn’t quite anticipated the way in which the Unders would mix with other Unders, and the disproportionate impact that opening the ale-houses would have on the ability of that group to socialise. 17/n
But they were smart wizards and quickly worked out what they needed to do. They knew that if the disease continued to spread like wildfire in the Unders, then eventually some Overs would catch it too (those without a hat, or with just one hat). 18/n
And then there was a good chance of the doctor becoming overwhelmed, and probably running out of leeches. So they advised the King to issue hats immediately to as many Unders as possible. (as well as to those Overs who didn’t yet have a second hat). 19/n
Did it work? Well, I’m honestly not sure yet. The sociable nature of Unders with each other works in our favour, because the King can quickly give hats to quite a large proportion of the Unders, and in theory that should have a big impact on the spread of the disease. 20/n
But on the other hand, the new form of the disease makes the hats work less well – and in particular, means that you really need 2 hats, not one, if you want to stop the disease in its tracks. So I’m not sure yet whether giving 1 hat to each Under will be enough. 21/n
Dropping out of the analogy, I feel I need to build a model just for the under-30s (who are, obviously, the equivalent of the Unders tribe in our real-life version of Bigpharmia). This needs to consider age-group-specific contact rates (with each other and other groups), 22/n
…the impact of the Steps specifically on their lives, age-specific vaccine take-up and the changing levels of immunity in that group, as well as the impact of Delta more generally. If we can bring the epidemic in that group under control, then it feels like we’ve won. 23/n
If on the other hand it continues to grow, then it will inevitably leak into other groups, and we’ll be worrying about stocks of leeches (ICU beds?) again. I’m not sure my existing model, or my intuition, is much help in deciding which of those two futures is more likely. 24/n
As I said at the start, this is a work-in-progress, and I’d welcome additions, challenges and corrections to this line of argument. Big thanks to @vaneylenv @pmholling @rufusSG @doug_no1 and others who have, knowingly or unknowingly, contributed parts of the jigsaw. 25/n
All errors, bad jokes and stretched analogies remain mine, of course. (except where stolen from @BristOliver). And to be clear: I’m not blaming anyone for this situation, just observing where the data is leading us, and trying to ensure we fully understand the dynamics. /end
PS the implied criticism of wizards above is mostly intended as self-critique – I feel we should have been able to spot this in advance, and I didn’t. To be fair to the real sages on SPI-M, their models do contain a good dose of age-stratification, and it’s possible this dynamic
…is a partial explanation for why those models were more pessimistic about the potential for a rise in cases at Step 3, compared to national-average models such as mine. But there isn’t much evidence in the published papers to date of them using the age-stratified outputs
...of the models to inform policy-making, nor afaik were they modelling the impact of the Steps with different factors for each age group – which may turn out with hindsight to be a missed opportunity. /endPS
apologies: should have credited @AdamJRuby and @ab83635723 here as well
• • •
Missing some Tweet in this thread? You can try to
force a refresh