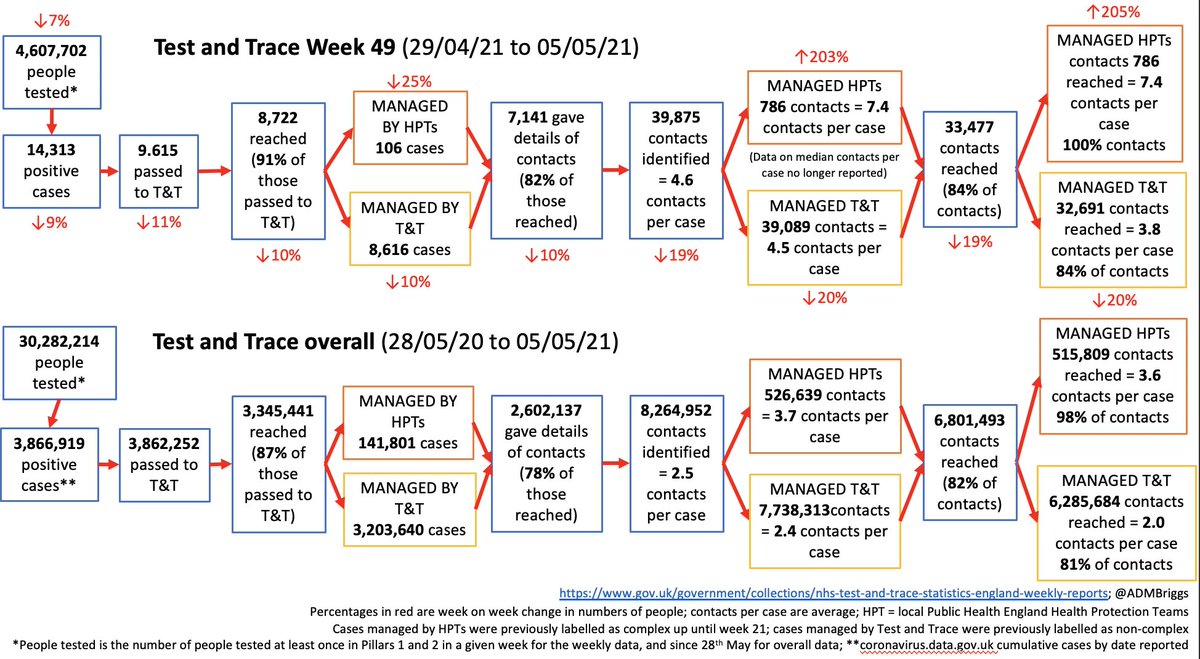
Latest @PHE_uk surveillance report is here, covering 31st May to 6th June.
- Case rates & positivity (% of tests that are positive)⬆️
- Number of individuals tested ⬇️(partly due to half term).
And case rates now ⬆️⬆️ among 20-29y/os.
🧵for detail
gov.uk/government/sta…
- Case rates & positivity (% of tests that are positive)⬆️
- Number of individuals tested ⬇️(partly due to half term).
And case rates now ⬆️⬆️ among 20-29y/os.
🧵for detail
gov.uk/government/sta…


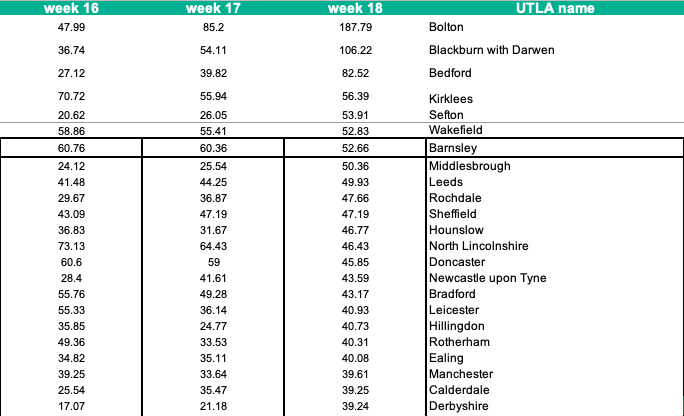
Looking by region, the uptick in case rates among 20-29y/o is really marked across multiple regions.
Why?
- combination of social mixing, less vax coverage, more transmissible virus
- much harder to discern from these data about possible role of cases in children moving up ages
Why?
- combination of social mixing, less vax coverage, more transmissible virus
- much harder to discern from these data about possible role of cases in children moving up ages

And worth also noting that as testing rates aren't rising, positivity is. Particularly among younger children (note again, half term), and 20-29yrs.
See also the symptom data.
See also the symptom data.


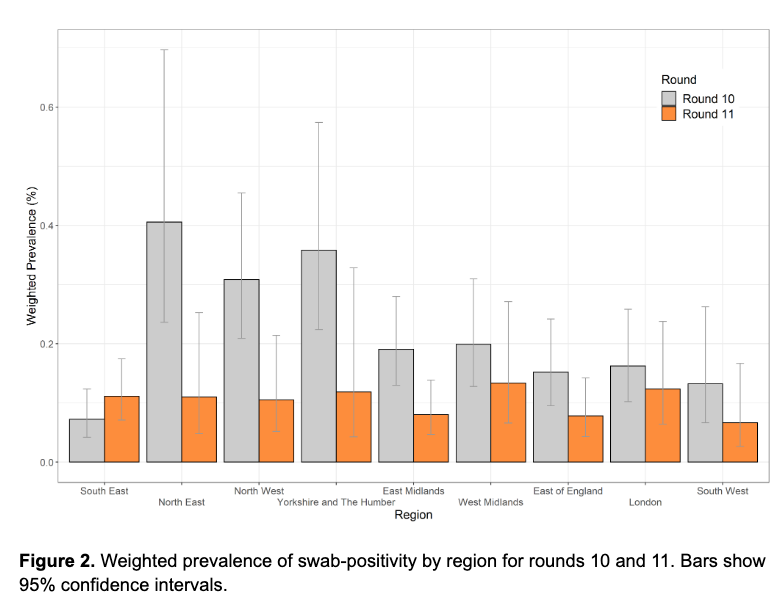
The pattern by age is not yet seen in the ONS data, although that's only to 29th May, with next update due tomorrow. Plus note v wide confidence intervals here.
ons.gov.uk/peoplepopulati…
ons.gov.uk/peoplepopulati…

The regional differences in case rates are as clear as they've ever been (and Cornwall's looking increasingly like a good choice for G7 - from a COVID perspective at least...)

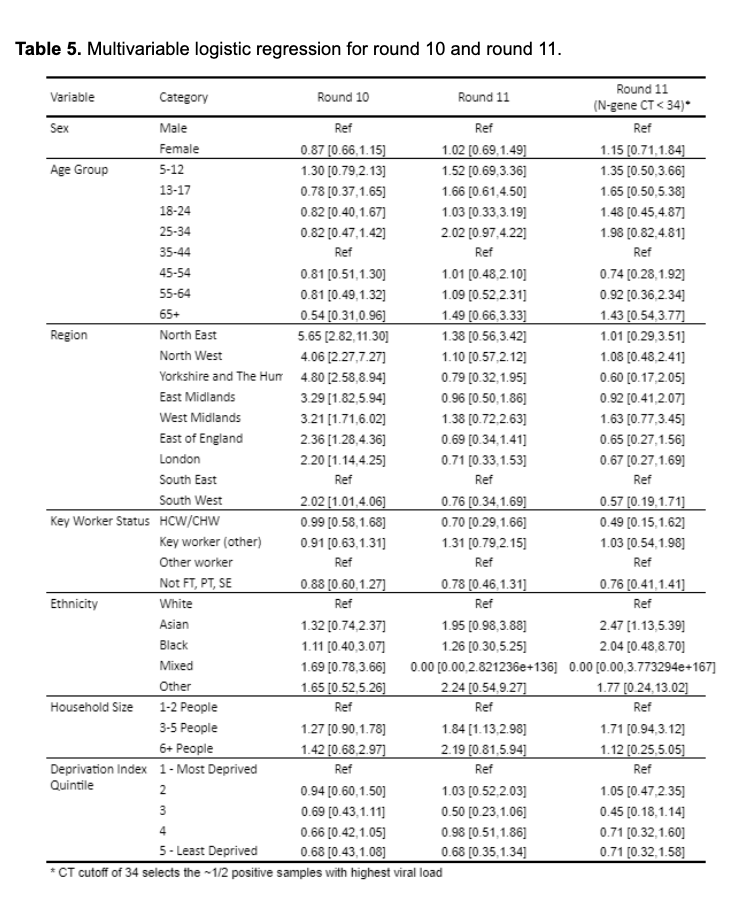
Differences by ethnicity and deprivation remain apparent as cases rise again.
The same population groups yet again impacted most. except interesting pattern in 17-19yo, perhaps an indication of less deprived 17-19yo more likely in school/college/uni and therefore exposed?
The same population groups yet again impacted most. except interesting pattern in 17-19yo, perhaps an indication of less deprived 17-19yo more likely in school/college/uni and therefore exposed?


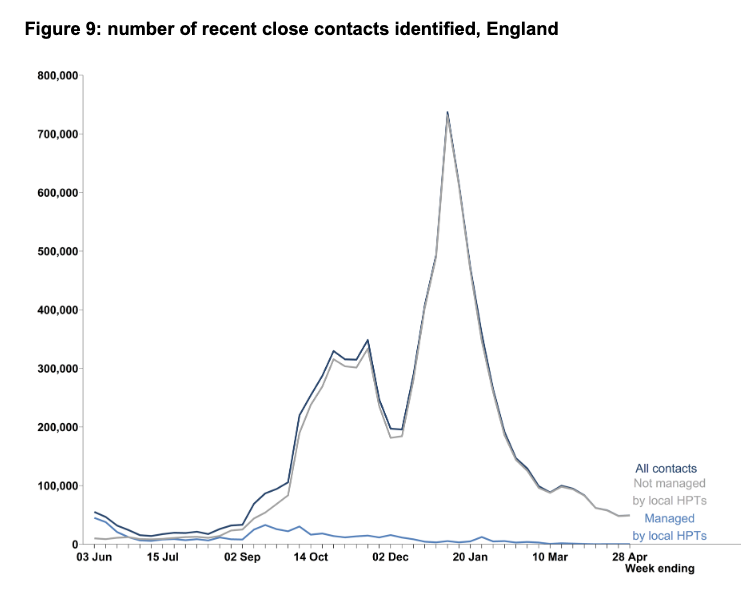
For notified outbreaks to PHE health protection teams.
Still great to see v low for care homes and hospitals
Still great to see v low for care homes and hospitals


And over half term, number of reported outbreaks in schools is same as previous week. Will be interesting to see if trends upwards as schools go back.
(note, this isn't ALL school outbreaks, only those reported to PHE, so the chart is helpful for trends but not overall picture)
(note, this isn't ALL school outbreaks, only those reported to PHE, so the chart is helpful for trends but not overall picture)


When it comes to hospitalisations and ICU admissions, these are definitely trending up.
The trajectory of this peak and the overall eventual impact on NHS capacity (and deaths) still seems v uncertain. Not to mention the impact of long COVID.
The trajectory of this peak and the overall eventual impact on NHS capacity (and deaths) still seems v uncertain. Not to mention the impact of long COVID.


Deaths are remarkably low.
There's a 3-4wk lag b/w infections & death. No signal yet, fingers crossed it stays that way.
But if more (particularly older) people do get infected, it'll lead to some deaths among those w/o vax or who don't respond to vax.
There's a 3-4wk lag b/w infections & death. No signal yet, fingers crossed it stays that way.
But if more (particularly older) people do get infected, it'll lead to some deaths among those w/o vax or who don't respond to vax.

The scale of this is really uncertain, but one thing for sure is that the impact on deaths will be far lower than it would have been w/o vax roll-out.
And on that, it's still charging forward with over 90% of everyone over 70yrs having had 2 jabs, as well as >55% of adults overall.🙌


But if the ethnicity data are still frankly shocking.
Not only are people from minority ethnic groups more likely to get COVID and have worse outcomes, but they're now less likely to be protected.
Despite the rollout to <30s, there is still loads to do among older adults.
Not only are people from minority ethnic groups more likely to get COVID and have worse outcomes, but they're now less likely to be protected.
Despite the rollout to <30s, there is still loads to do among older adults.

I'm sure this all means different things to different people.
For me, there's big regional variation but overall, case-rates are rising exponentially with hospitals now seeing cases.
Meet outdoors where possible, wear a mask where necessary, test, and get vax when offered.🙏
For me, there's big regional variation but overall, case-rates are rising exponentially with hospitals now seeing cases.
Meet outdoors where possible, wear a mask where necessary, test, and get vax when offered.🙏
PHE surveil rpt ☝️ @felly500 @deb_cohen @martinmckee
@carolecadwalla @mgtmccartney @ADPHUK @Jeanelleuk @profchrisham @petermbenglish @HPIAndyCowper @Davewwest @HSJEditor @KateAlvanley @IndependentSage @nedwards_1 @SamanthaJonesUK @ewanbirney @FurberA @Dr_D_Robertson
@carolecadwalla @mgtmccartney @ADPHUK @Jeanelleuk @profchrisham @petermbenglish @HPIAndyCowper @Davewwest @HSJEditor @KateAlvanley @IndependentSage @nedwards_1 @SamanthaJonesUK @ewanbirney @FurberA @Dr_D_Robertson
• • •
Missing some Tweet in this thread? You can try to
force a refresh