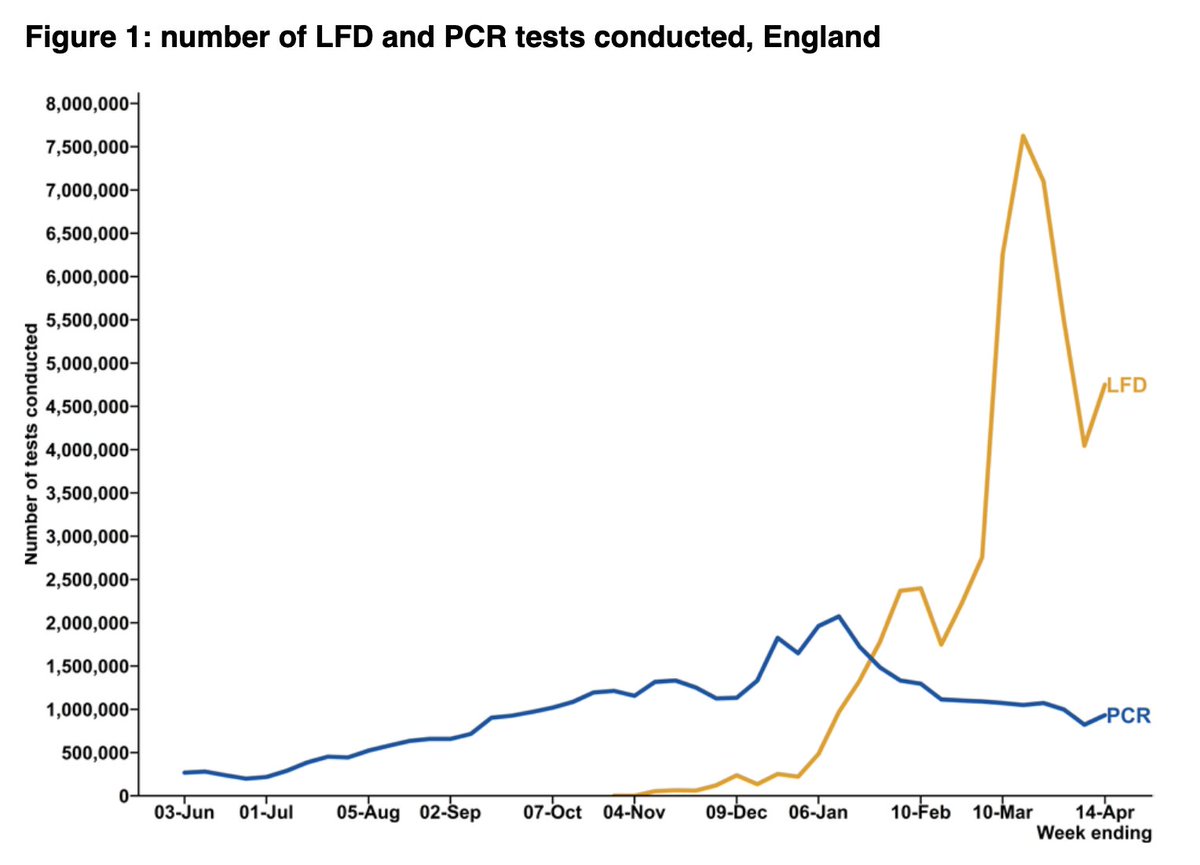
Latest T&T data: wk 22-28 April
- no big shifts in numbers tested by LFDs/PCR, and ongoing fall in +ve cases
- but some interesting changes in contact tracing: fewer contacts reached and it's taking longer, and the reasons aren't straightforward🧵
gov.uk/government/pub…
- no big shifts in numbers tested by LFDs/PCR, and ongoing fall in +ve cases
- but some interesting changes in contact tracing: fewer contacts reached and it's taking longer, and the reasons aren't straightforward🧵
gov.uk/government/pub…
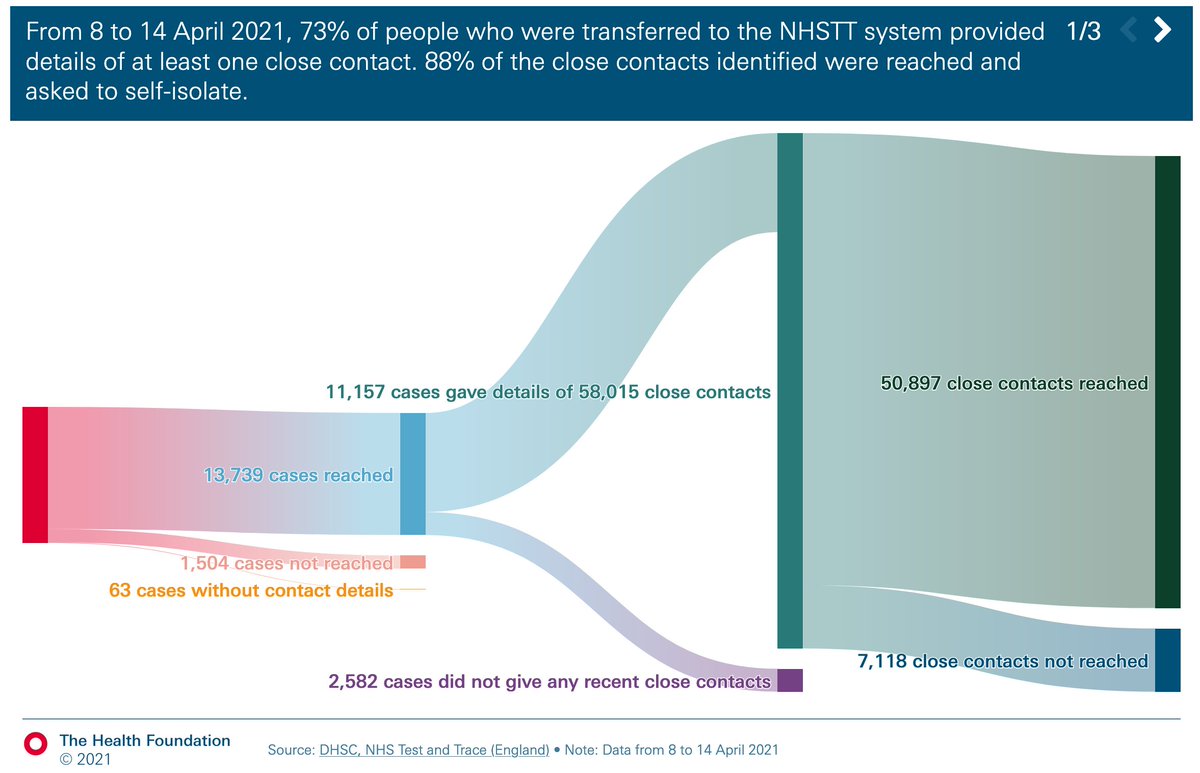
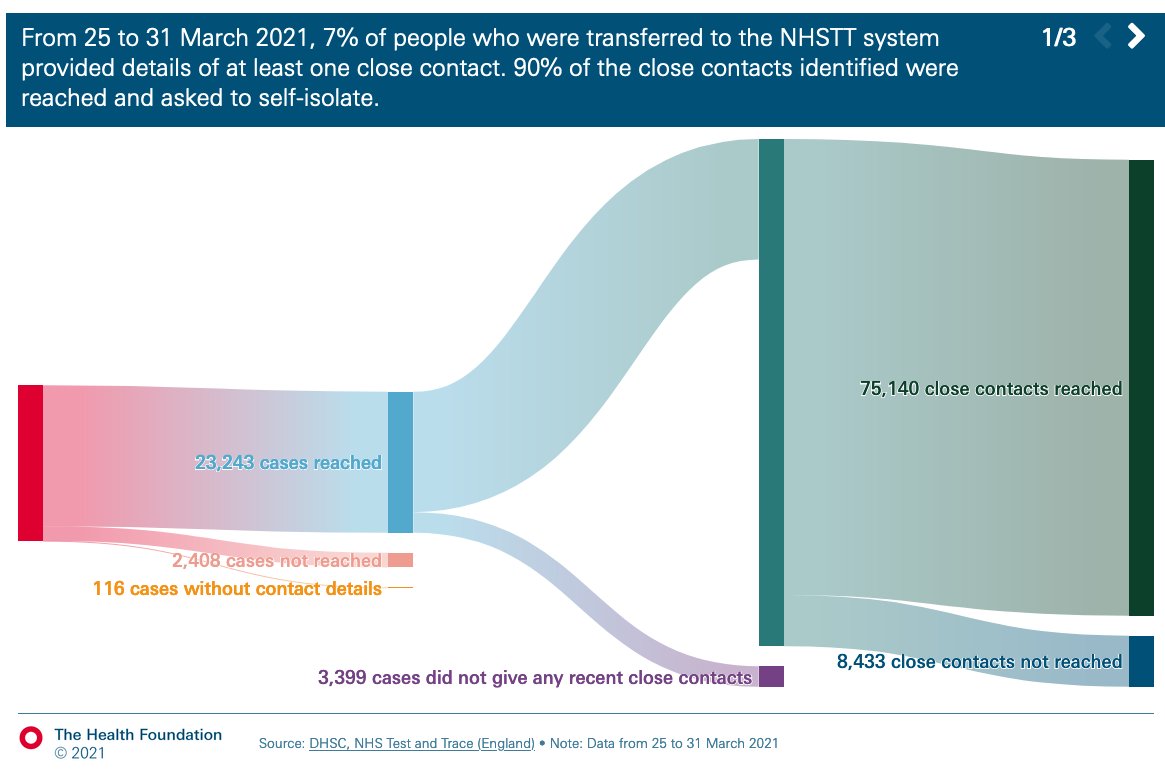
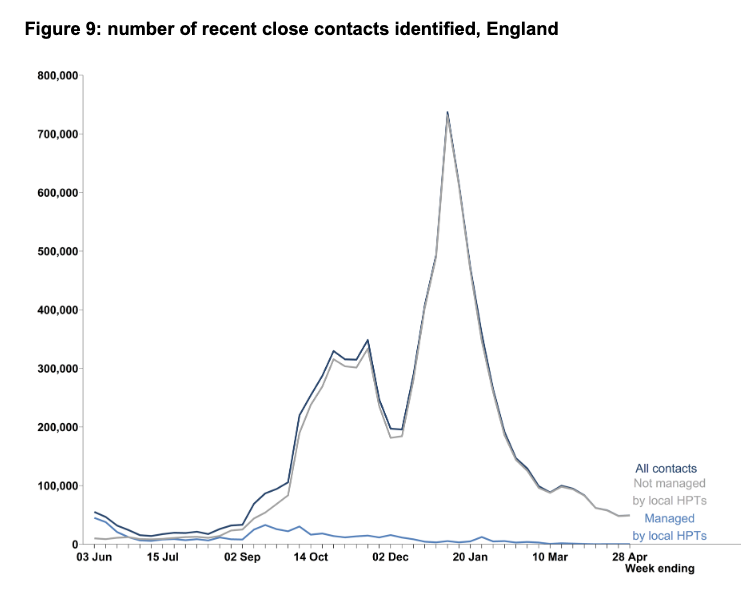
While the number of cases transferred to contact tracing fell by 12% to 10,793, the number of close contacts identified rose by 2% to 49,151.
For the first time since the start of August, avg contacts per case was >5.
For the first time since the start of August, avg contacts per case was >5.

And of those contacts, the percentage reached has dropped wk on wk for the past 5 weeks, from 90% to 84%.

BUT - this is almost all explained by change in the proportion of close contacts that are from the same household. Which has been plummeting.
There's no change in % of HH and non-HH contacts reached, consistently around 96% and 75% respectively in each setting.
There's no change in % of HH and non-HH contacts reached, consistently around 96% and 75% respectively in each setting.

More contacts overall and a greater proportion from a different HH reflects greater social mixing.
And the consequences are also seen in some of the timeliness data.
Percentage of contacts reached within 24 hrs has fallen a touch from 98.2% to 96.% in recent weeks.
And the consequences are also seen in some of the timeliness data.
Percentage of contacts reached within 24 hrs has fallen a touch from 98.2% to 96.% in recent weeks.

But the percent contacts reached from the time the case is transferred to T&T has really deteriorated. Falling from 70% to 46% reached within 24hrs over the last 5 weeks.

The same is also seen in the end-to-end time.
Most recent data show 61% of contacts reached within 3 days of case taking a test, compared with >80% at the end of March.
Most recent data show 61% of contacts reached within 3 days of case taking a test, compared with >80% at the end of March.


Finally on this, test turnaround time is relatively stable.

Given
- only small fall in % of contacts reached within 24hrs of being identified
- stable test turnaround times
- but significantly worsening end to end times
it follows that problems lie mainly with time to reach cases rather than contacts.
- only small fall in % of contacts reached within 24hrs of being identified
- stable test turnaround times
- but significantly worsening end to end times
it follows that problems lie mainly with time to reach cases rather than contacts.
The report explains that longer time is partially due to international arrivals.
This may make sense if it takes time to identify/log all passengers on a flight.
But once known, contacting should be straightforward as details should be collected following int'l travel
This may make sense if it takes time to identify/log all passengers on a flight.
But once known, contacting should be straightforward as details should be collected following int'l travel

Which in turn, should mean that if international arrivals are partially driving increased end to end time and increasing proportion of non-household contacts seen in the data,
then given contact details of travellers are made available for follow up...
then given contact details of travellers are made available for follow up...
the percentage of non-HH contacts reached should be increasing. Which it isn't.
Unless it's offset by difficulties in reaching non-household contacts of non-travel related cases
Either way, it's not straightforward to unpick and is still unlikely to explain all the changes seen
Unless it's offset by difficulties in reaching non-household contacts of non-travel related cases
Either way, it's not straightforward to unpick and is still unlikely to explain all the changes seen
I'm sure I've missed some explainers/detail here. But bottom line is that while much is still going fairly well, it's all taking a bit longer.
And this all has implications for containing viral spread, particularly around imported cases and potential variants of concern. /end
And this all has implications for containing viral spread, particularly around imported cases and potential variants of concern. /end
wk 48 T&T ☝️ @felly500 @deb_cohen @martinmckee @carolecadwalla @mgtmccartney @ADPHUK @Jeanelleuk @fascinatorfun @profchrisham
@petermbenglish @HPIAndyCowper @Davewwest
@HSJEditor @KateAlvanley @IndependentSage
@nedwards_1 @chrischirp @SamanthaJonesUK
@petermbenglish @HPIAndyCowper @Davewwest
@HSJEditor @KateAlvanley @IndependentSage
@nedwards_1 @chrischirp @SamanthaJonesUK
@ewanbirney @TimHarford @devisridhar @FurberA
@andrewleedr @kieran_walshe @DrChadborn @Dr_D_Robertson
@andrewleedr @kieran_walshe @DrChadborn @Dr_D_Robertson
• • •
Missing some Tweet in this thread? You can try to
force a refresh