
Graphic review time!
This is one of two information posters from @AcheleKelpfish about Massachusetts Bays National Estuary Partnership: mass.gov/orgs/massachus…
🧵 1/14
This is one of two information posters from @AcheleKelpfish about Massachusetts Bays National Estuary Partnership: mass.gov/orgs/massachus…
🧵 1/14
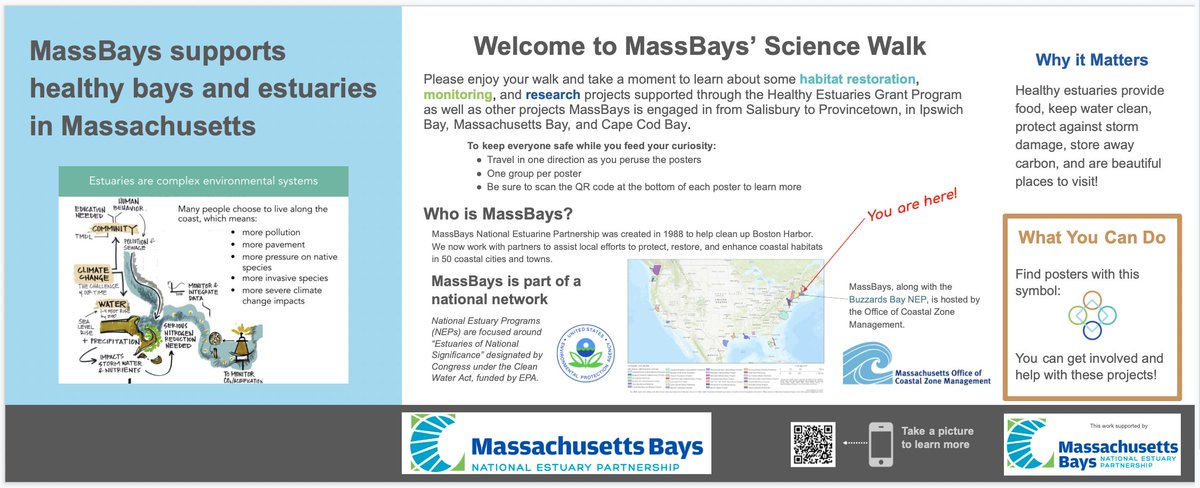
From the title and shape, I am guessing that this is meant to be one of those graphics that stand alongside trails as people walk around. 🚶♀️🚶♂️
This means most people are there for the scenery and not the information, so it could be a TOUGH crowd to reach! 2/14
This means most people are there for the scenery and not the information, so it could be a TOUGH crowd to reach! 2/14

With a big, wide, poster like this, people are probably going to just glance at it first.
What attracts their attention first? Is it a good entry point? 3/14
What attracts their attention first? Is it a good entry point? 3/14
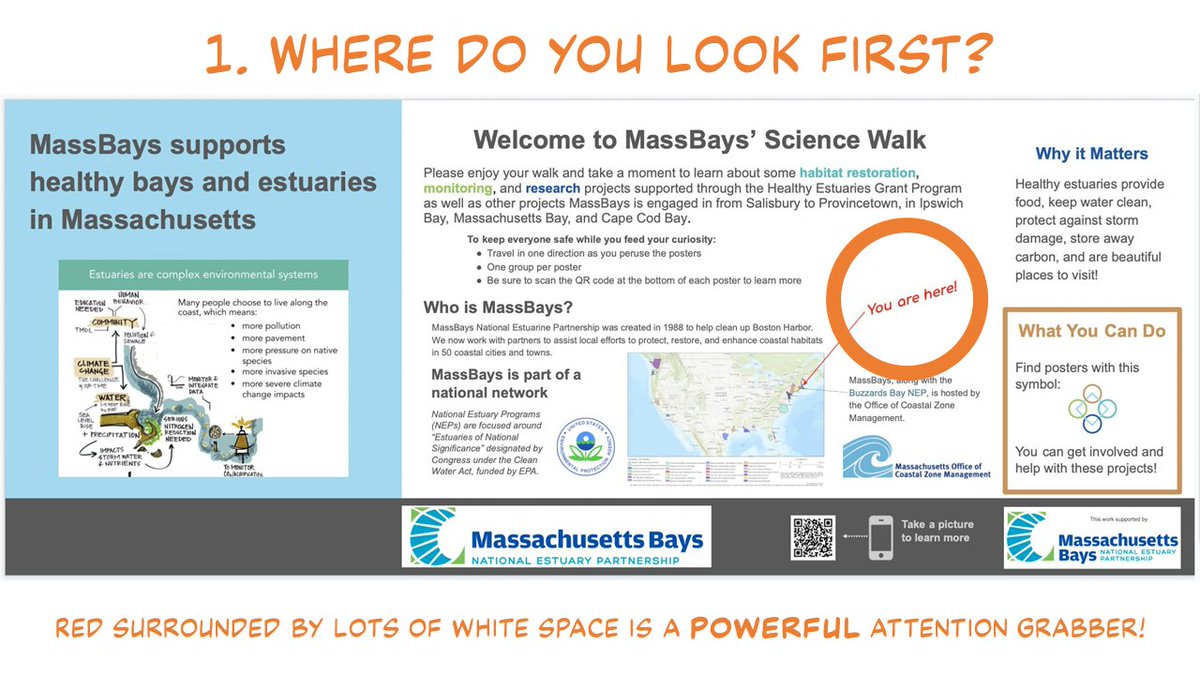
When I first looked at this, my eyes 👓 instantly popped to "You are here."
It's red 🔴, standing alone surrounded by lots of white space, and set at a jaunty angle. ALL of those signal, "Hey, I'm important, look at me!" 👀 4/14
It's red 🔴, standing alone surrounded by lots of white space, and set at a jaunty angle. ALL of those signal, "Hey, I'm important, look at me!" 👀 4/14

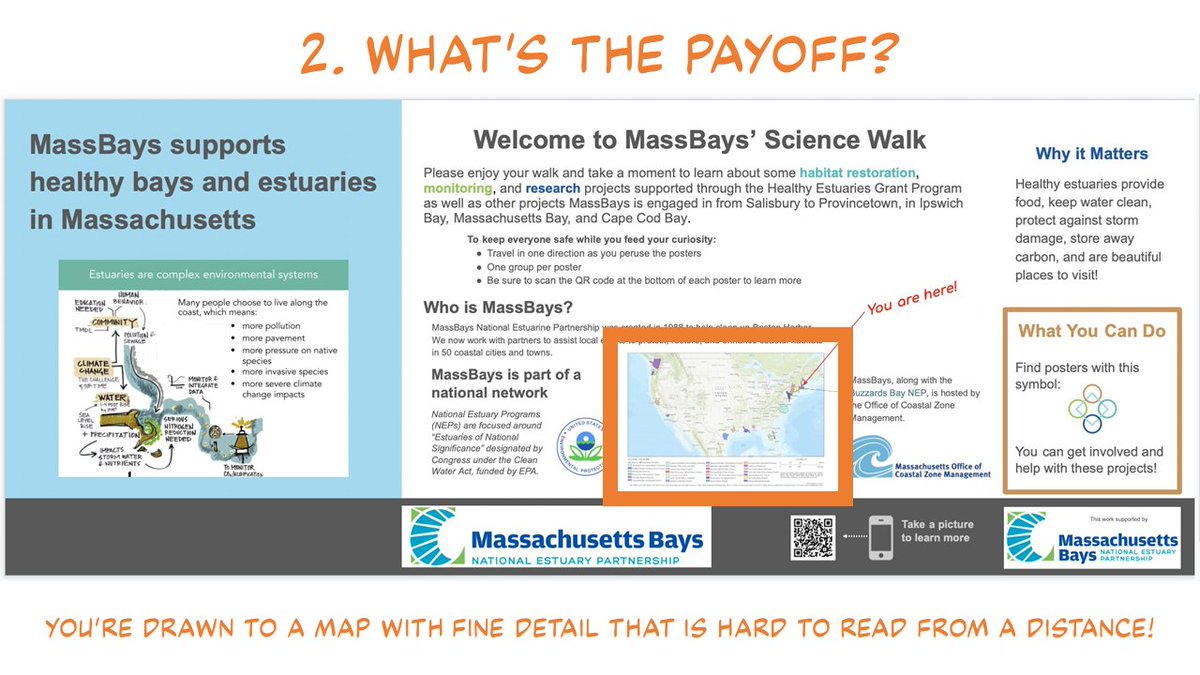
"You are here" is important to people, because people LOVE 😍 to see themselves reflected in the poster.
But where you are supposed to see your position is maybe not optimized for viewing from a distance. The map is low contrast with lots of fine details. 5/14
But where you are supposed to see your position is maybe not optimized for viewing from a distance. The map is low contrast with lots of fine details. 5/14
"Welcome" is usually the FIRST thing people expect to hear (or read).
I'm not sure that priority is established visually here. 6/14
I'm not sure that priority is established visually here. 6/14
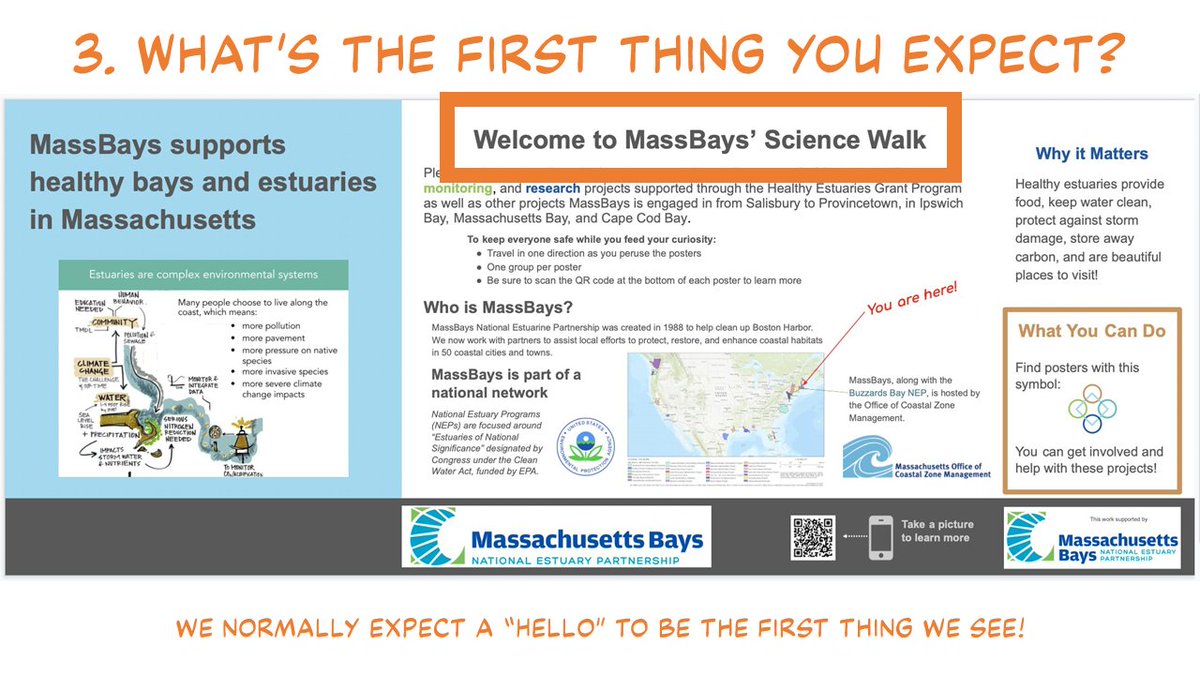
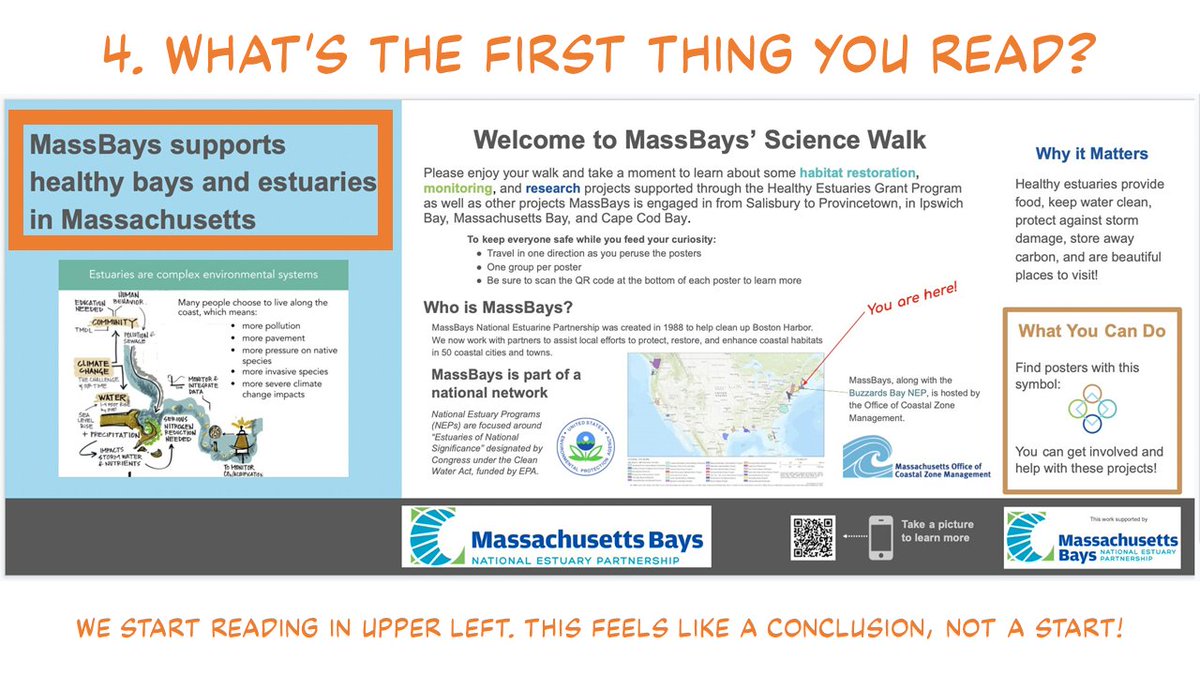
If you want to read the poster, you will probably want to start in the upper left corner. ↖
This almost reads like a sidebar, an aside, not a start point. (If it is, maybe it could go on the right? ➡) 7/14
This almost reads like a sidebar, an aside, not a start point. (If it is, maybe it could go on the right? ➡) 7/14
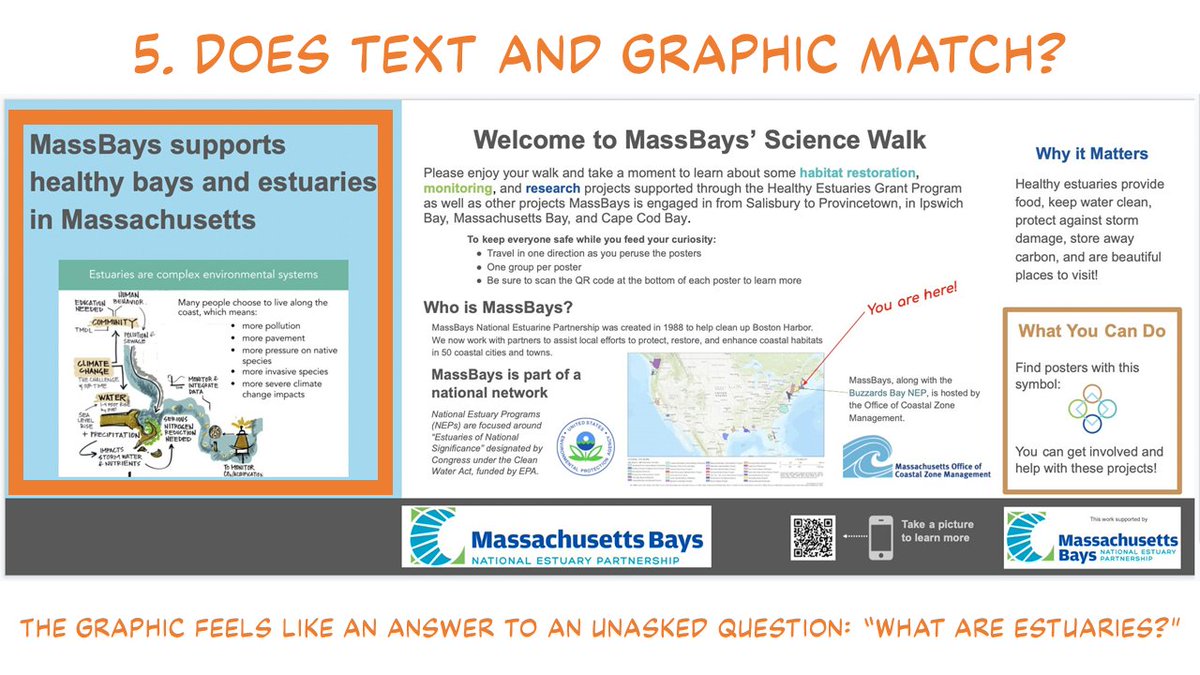
The left heading talks about bays and estuaries, but the left graphic heading only mentions the latter.
The left graphic seems to answer the question, "What are estuaries?", which isn't asked in the heading. 8/14
The left graphic seems to answer the question, "What are estuaries?", which isn't asked in the heading. 8/14
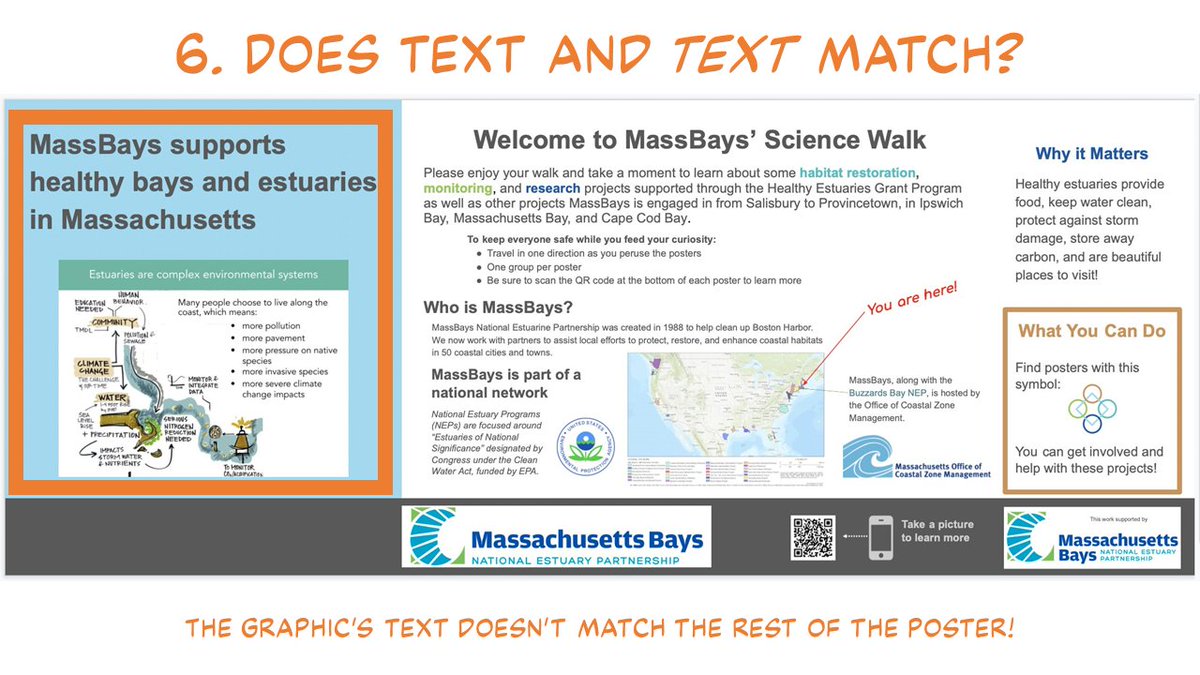
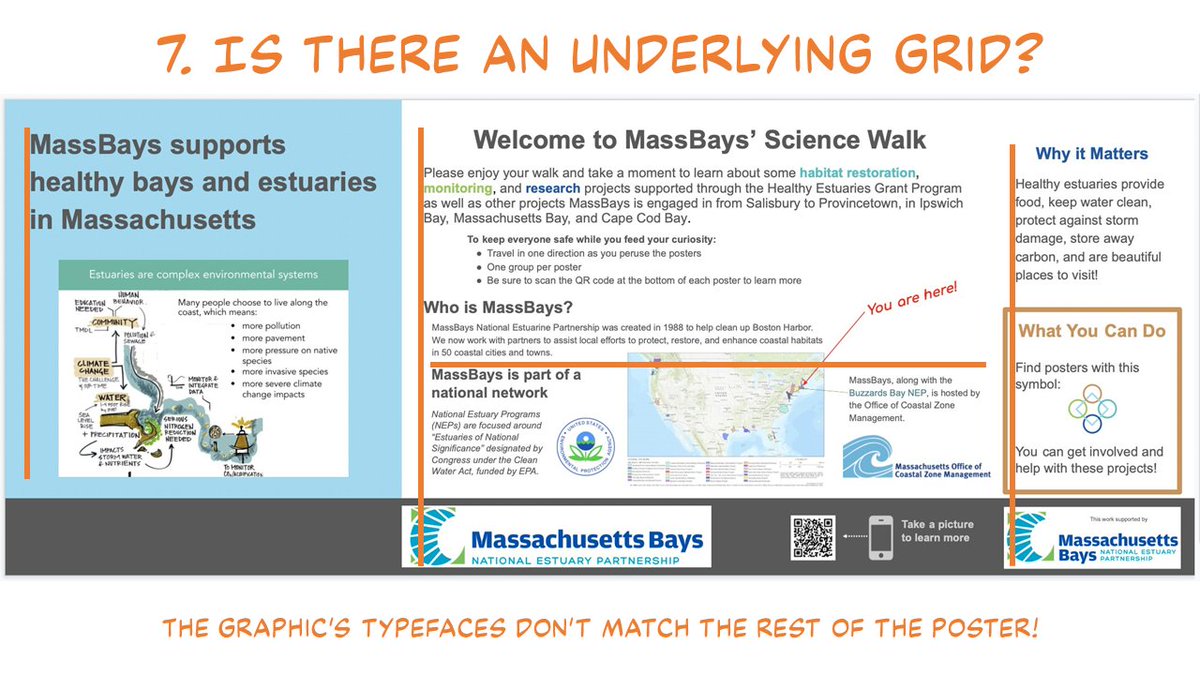
The left graphic has different typefaces and an overall style than the rest of the poster. 9/14
Alignment helps signal organization. While the main blocks are fairly well organized, there's a lot of "drift" in placement of items. 10/14
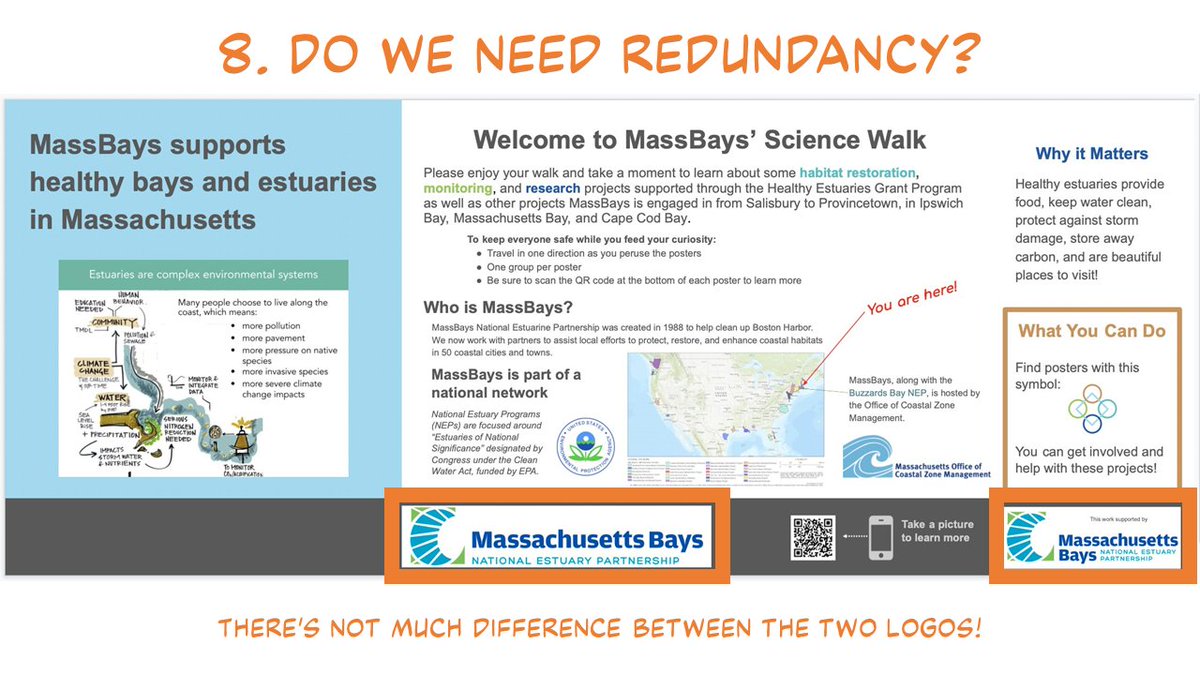
The logos are sensibly down in the "fine print zone" in the bottom. ⬇
I am wondering why there are two similar logos down there. 11/14
I am wondering why there are two similar logos down there. 11/14
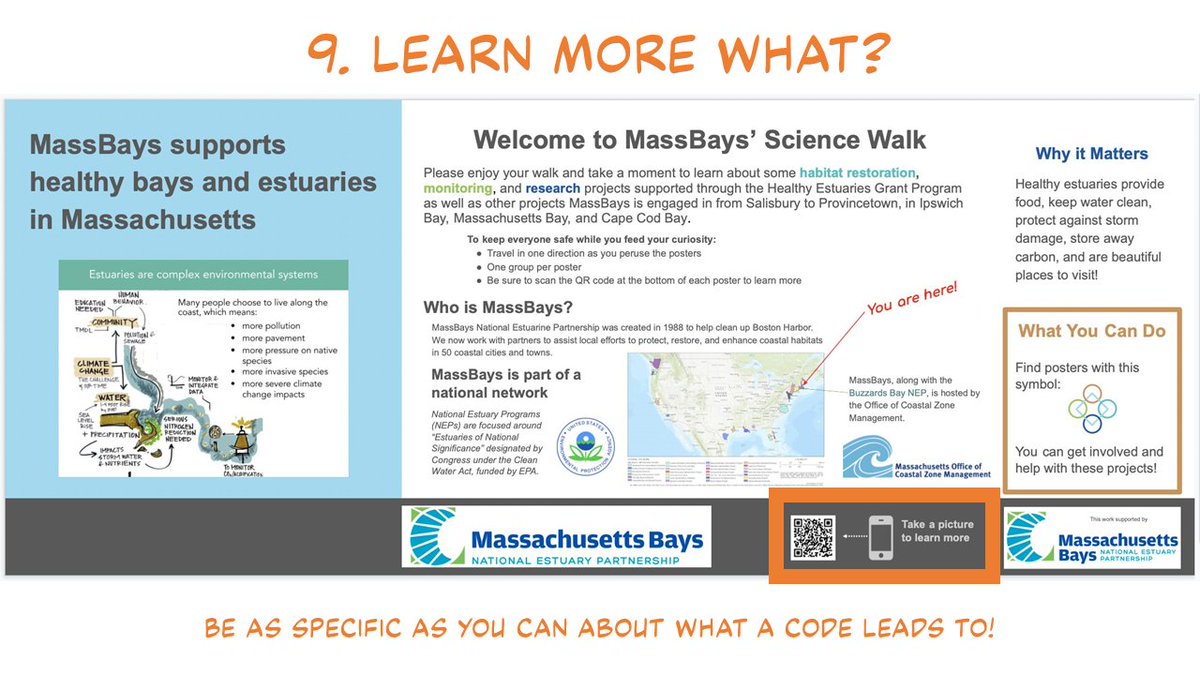
For a project like this, I could imagine websites visits through the QR code being a measure of success.
You have to entire people to scan a QR code: They need to know what the carrot is. 🥕
"Learn more" is maybe not the juiciest carrot. 12/14
You have to entire people to scan a QR code: They need to know what the carrot is. 🥕
"Learn more" is maybe not the juiciest carrot. 12/14
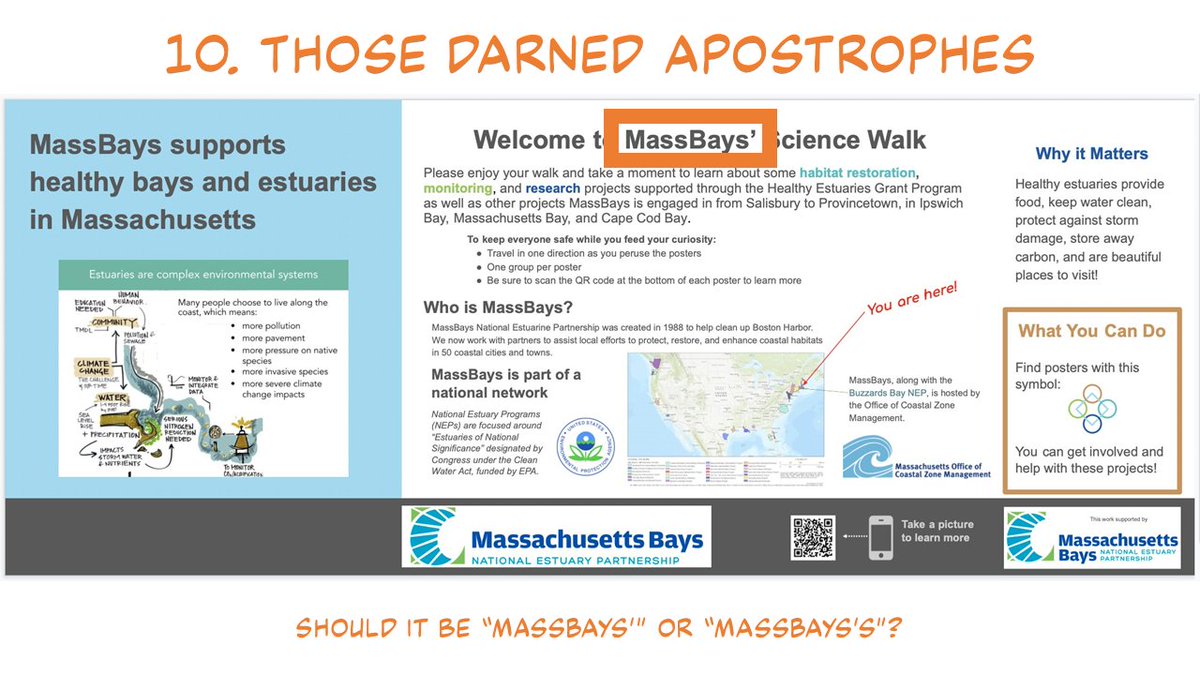
I'm sure someone who knows copy editing better than me can say whether there should be another "S" here.
Is it "MassBays'" or "MassBays's"?
A quick web search shows conflicting opinions. 13/14
Is it "MassBays'" or "MassBays's"?
A quick web search shows conflicting opinions. 13/14
That said: The poster could go up as it is and nobody would be embarrassed 😳 by it.
These suggestions are just that: suggestions.
I hope those comments helped, @AcheleKelpfish! 14/14
These suggestions are just that: suggestions.
I hope those comments helped, @AcheleKelpfish! 14/14
• • •
Missing some Tweet in this thread? You can try to
force a refresh


