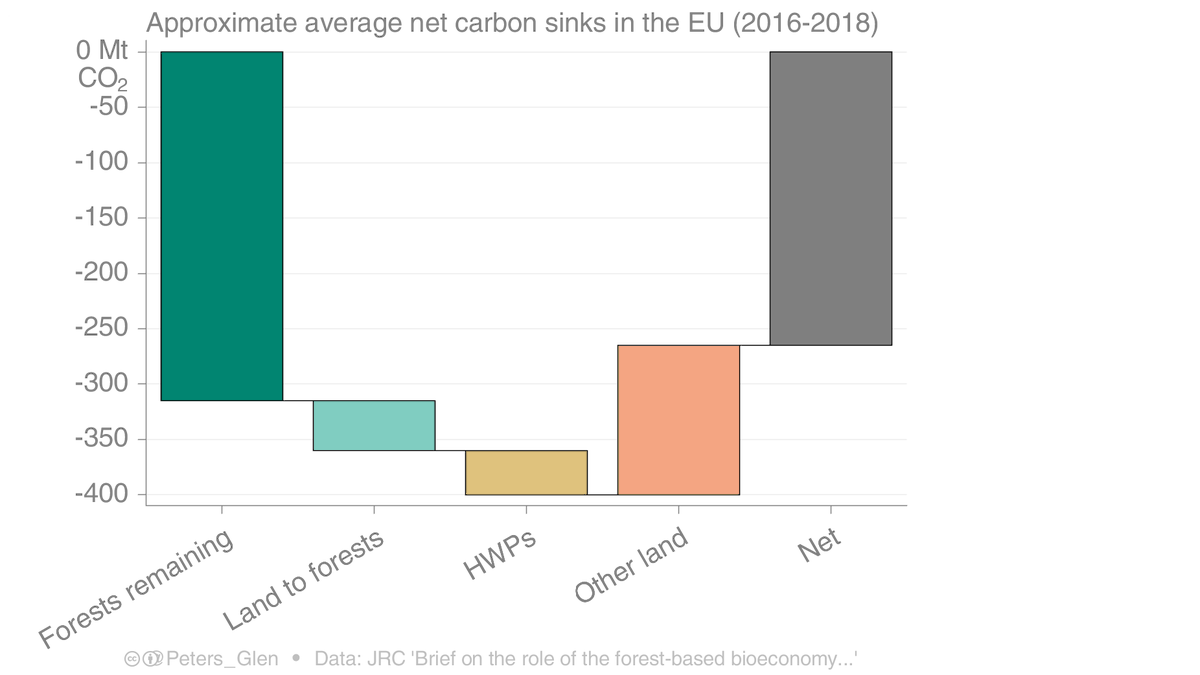
The EU has a LULUCF sink of ~250MtCO₂/yr:
* ~300MtCO₂/yr is forests remaining forests (a share of which is due to climate change & CO₂ fertilisation)
* ~50MtCO₂/yr is land converted to forests
* ~50MtCO₂/yr is increased storage in wood products
* The rest is a source
1/
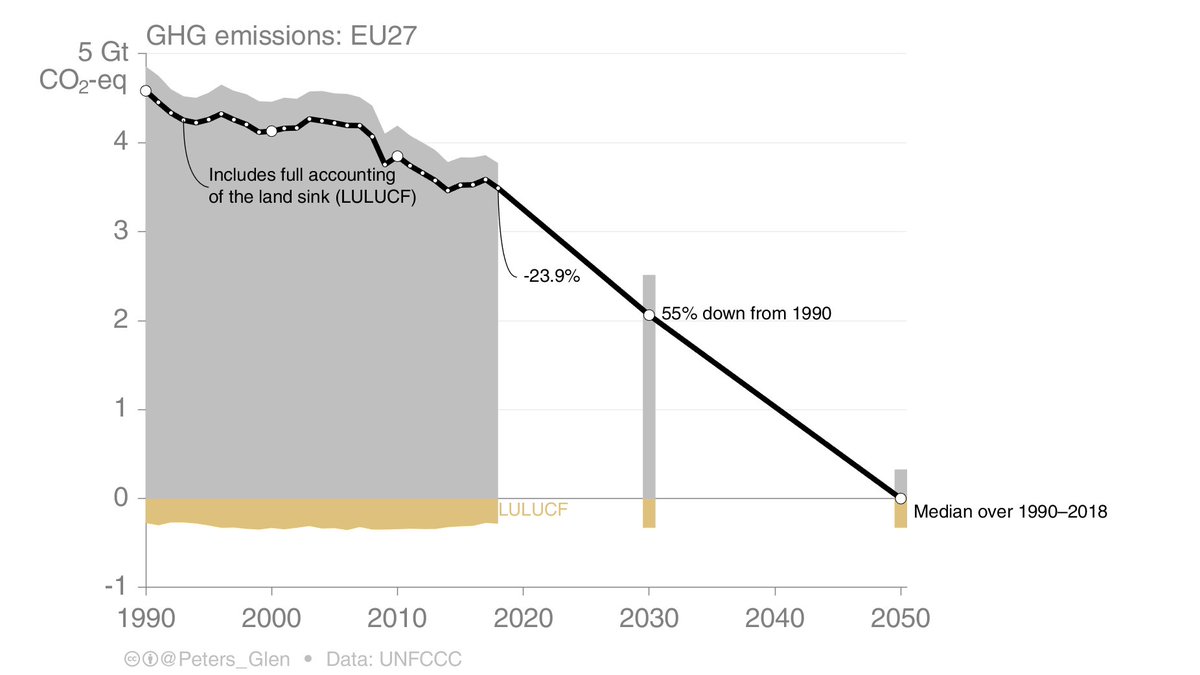
This sink has a huge policy significance, as the sink allows to offset emissions in hard-to-mitigate sectors & reach net zero in 2050.
But, using forests could also help reach net-zero by displacing some fossil fuels?
2/
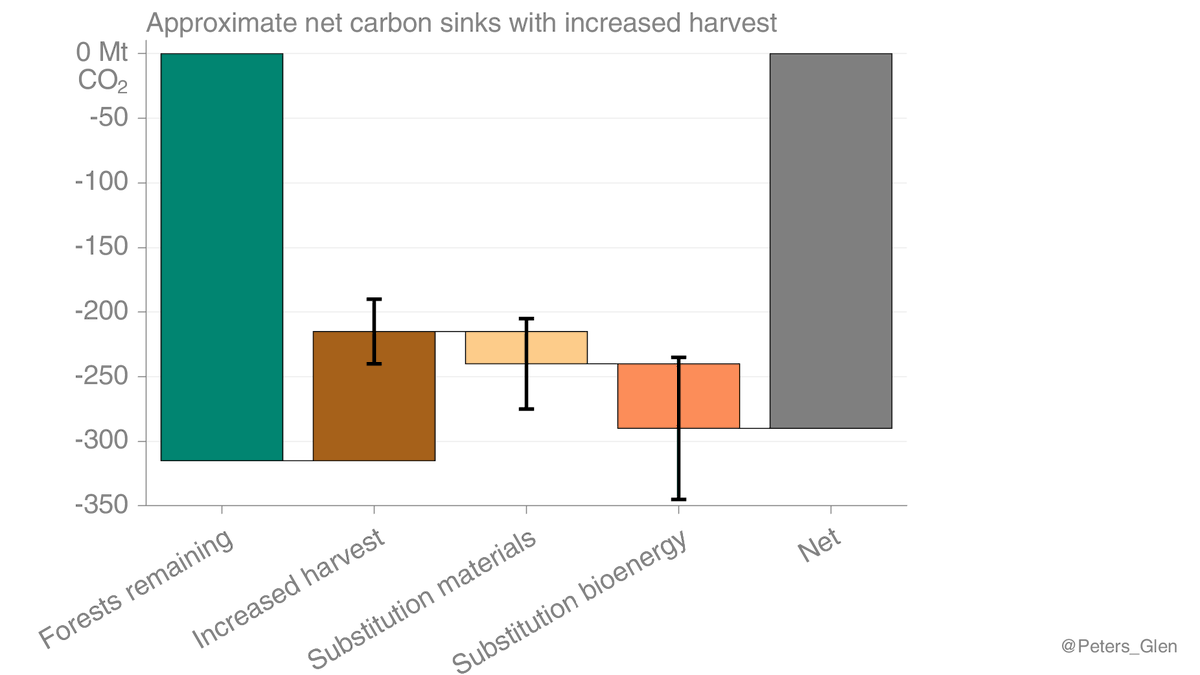
Just focusing on forests, the EU could increase harvest, weakening the sink, & use the harvest to displace materials (e.g. cement in construction) or fossil fuels (e.g., bioenergy).
An additional issue is that integrated assessment models do not include the sink from forests remaining forests, so hard to assess these issues in an IAM.
But here lies the problem. The tendency is then to make models more complex. This does not solve the problem. Models are so complex barely anyone can understand what drives what.
Reform is needed so "researchers can examine the trade-offs between making models tractable & making them more useful for real-world decisions"
To me, this means you need different types of models, different types of tools & approaches, not bigger models.
2/
Overwhelmingly, it seems most research funding is aimed at building more complex models. And nearly all funding is tied up by the big modelling groups.
Imagine an ERC or EU project, "here is my simple toy model". Laughed out of the room, but this is what is needed.
3/
Increasingly scenario users are interested in 'where we are heading' as a baseline, rather than no climate policy scenarios (light grey) & SSP5-85 (RCP85).
Current policies may take the world to ~3.2°C (10-90% range 2.3-4.4°C due to climate uncertainties), which is much less than >5°C in SSP5-85.
The bold lines are from the NGFS scenarios used by financial institutions for 'stress testing', the thin lines are from IPCC SR15.
2/
Another organisation that has been doing work on 'where we are heading' is the @climateactiontr, which has quite consistent numbers as the NGFS (though quite different methods).
* NGFS is based on modelling
* CAT is more a statistical approach
I had a poll the other day on "Orderly" versus "Disorderly" energy transitions. This wording comes from the @NGFS_.
I have troubles with saying immediate implementation of global 1.5°C climate policies is orderly. Perhaps in a model but not in reality.
A few thoughts...
1/
A global carbon price of 150 or 200$/tCO₂ in 2025 is the difference between Orderly & Disorderly? (blue versus purple). You are kidding me?
Or a delay of 10 years and then a carbon price of 250$/tCO₂ is disorderly?
2/
This is reduction in coal in the various NGFS mitigation scenarios.
* Which one looks orderly?
* Which country would find implementing an economy wide climate policy overnight orderly?
How does the global average temperature increase compare to atmospheric CO₂ concentrations in the last ~100 years?
It is quite a linear relationship, with a 2.7°C increase for a doubling of CO₂ concentration.
This includes non-CO₂ effects, which approximately cancel.
1/
This tweet was inspired by a comment by @GregFlato based on this figure by @RARohde
"If you multiply by 270ppm to make it comparable to TCR & ECS, you get something we might call ‘instantaneous climate sensitivity’ (ICS) which comes out to be 2.7C"
Global CO₂ emissions grew at 2.6%/yr in the 2000s, but this dropped to 1.0%/yr in the 2010s.
Can we see this in the atmosphere?
If emissions growth continued at 2.6%/yr in the 2010s, it would lead to ~0.3ppm difference in 2019, or cumulatively 1.3ppm over the 2010s.
1/
How did I do this? 1. Assume emissions continued at 2.6%/yr from 2010 2. Get difference with current emissions 3. Multiply by airbourne fraction (AF, estimated 1960-2010, 0.43) to estimate atmospheric increase 4. Convert to ppm (1ppm = 2.124GtC, GtCO2 = 3.664 GtC).
Simple!
2/
We should see this in the atmosphere, but how confidently given variability?
The effective difference in growth rates is ~2%, which we should be able to detect after 5-10 years. Though, note in the commentary, we compared 1% & -1%, not 2.5% & 1%. rdcu.be/buifD
3/
"It is not obvious that the cheapest resources with the lowest carbon footprint lie in the resources already discovered... To stop exploration at this time would cause a major threat to the world's energy security", are the arguments from the Norwegian Oil & Gas lobby
2/
"Recent polls have shown that 60% to 70% of voters continue to support future Norwegian oil & gas production"
[Perhaps the political niche is threading the needle between investment for old & new fields, taking the IEA's lead]
3/