Another excellent chart idea from @BristOliver

Just as in previous waves, cases today are an excellent guide to where hospital admissions will be 10 days into the future.

But there is a difference this time around, and here come two charts to illustrate it...
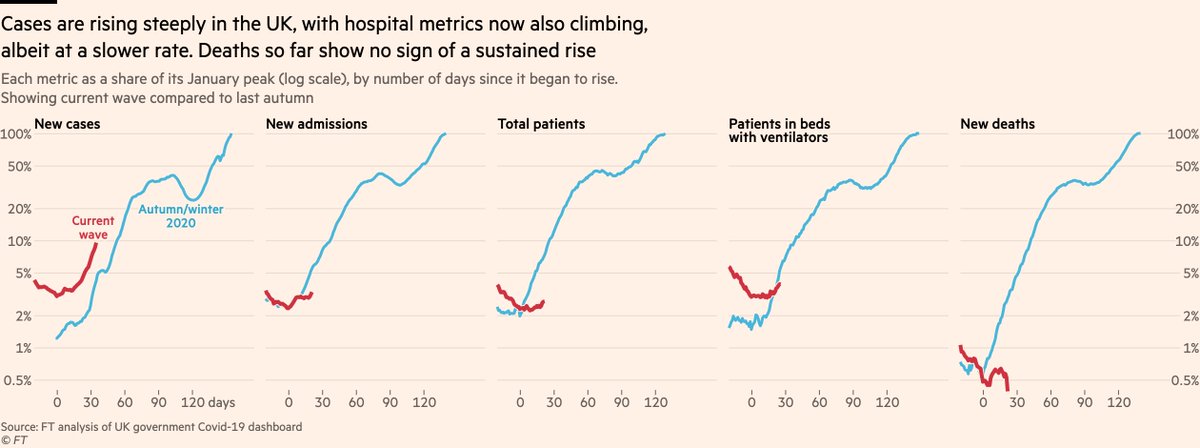
Here’s the same data, but adding the autumn/winter wave, and expressing everything as % of January peak

Spot the difference between waves:

Admissions track cases ~perfectly both times, but this time red admissions line is lower: a smaller share of cases require hospital (💉💪)
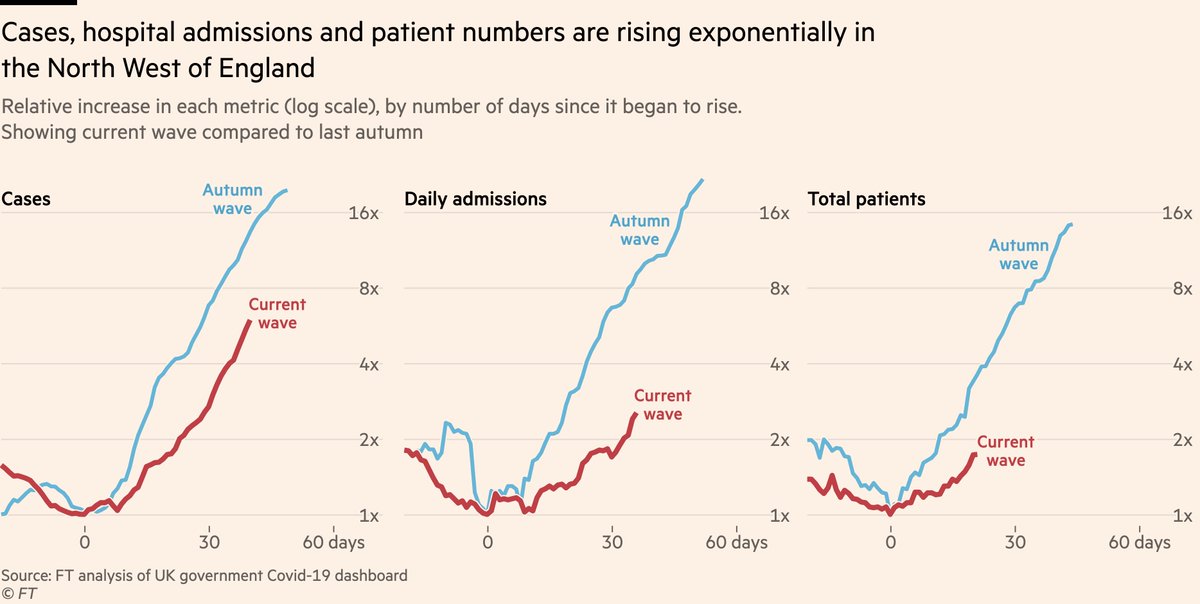
And here’s the same data using another @BristOliver concept: admissions as share of cases 10 days earlier.

Today admissions are ~4% of lagged cases. At this point in the autumn wave, they were ~8%.
To conclude:

A wave is still a wave, and admissions still follow cases, but vaccines mean fewer cases are now severe enough to require hospital.

Keep getting your jabs, folks.
And what feels like an obligatory addendum these days:

No, saying that vaccines are reducing hospitalisation rates is not saying "nothing to worry about here folks".

4% of cases can still mean a lot of admissions when cases are very high.

But it’s better than 8%.

• • •

Missing some Tweet in this thread? You can try to force a refresh
 

Keep Current with John Burn-Murdoch

John Burn-Murdoch Profile picture

Stay in touch and get notified when new unrolls are available from this author!

Read all threads

This Thread may be Removed Anytime!

PDF

Twitter may remove this content at anytime! Save it as PDF for later use!

Try unrolling a thread yourself!

how to unroll video
  1. Follow @ThreadReaderApp to mention us!

  2. From a Twitter thread mention us with a keyword "unroll"
@threadreaderapp unroll

Practice here first or read more on our help page!

More from @jburnmurdoch

16 Jun
A huge thanks to everyone at the FT who made this possible. Both the rest of the brilliant data/visuals team, and the editors and reporters across the rest of the FT who really *get* the power of data journalism more than any other newsroom I've encountered.
We're not in the business of making charts to dress-up stories. We make charts that *are* the stories.
Read 10 tweets
11 Jun
NEW: UK’s full reopening is set to be postponed by a month due to resurgence in cases — and now hospitalisations — fuelled by the Delta variant.

Story ft.com/content/fa7c25…

Thread: first up, that core data: UK admissions, patients & ventilator bed numbers now all climbing
An obvious initial point to make: whilst the rate of increase in cases is just as steep as it was last autumn, the hospital metrics are climbing more slowly.

This is good news (!), but it comes with nuances that point in both an optimistic and pessimistic direction.
The pessimistic: until recently admissions in Wales and Northern Ireland were falling steeply, which was countering rises elsewhere and making UK totals flatter than they would otherwise be.

In the last week, admissions have risen in every UK region but one: the East of England.
Read 17 tweets
8 Jun
NEW: latest data now show a clear rise in hospital admissions in the UK, and numbers could climb rapidly.

Admissions & patient numbers in the North West are ~straight lines on a log-scale: exponential growth

Our story, with @mroliverbarnes & @AndyBounds: ft.com/content/f2ae00…
Let’s take a closer look at that chart
• Cases have been rising at a similar rate to previous waves for some time now
• What’s new is hospital admissions now undeniably following suit. In North West, admissions rose by 30% in week ending May 30th. Since then they’ve climbed 40%
This is despite vaccines that offer good protection against hospitalisation, so what’s going on?

As ever, age breakdowns tell the story. Hospital admissions remain low and flat among mostly-double-dosed older groups, but the increase is coming among younger adults.
Read 14 tweets
4 Jun
Excellent new study on how Pfizer fares against the different variants.

Conclusion remains: second dose is critical.
Some notes:
• Remember, antibody neutralisation is not the same as vaccine efficacy. 5.8-fold reduction in the former does not mean the same thing for the latter
• This paper shows a 2.2-fold reduction in neutralisation for Delta relative to Alpha (5.9 / 2.6). PHE data so far points to a ~10% drop in VE for Delta vs Alpha after two doses of Pfizer, so you can see how the two numbers are on very different scales
Read 7 tweets
27 May
NEW: B.1617.2 is fuelling a third wave in the UK, with not only cases but also hospital admissions rising.

Vaccines will make this wave different to those that have come before, but it remains a concern, and one that other countries will soon face.

Thread on everything we know:
First, cases in the UK.

It’s been clear for some time that B.1.617.2 has been driving local outbreaks in North West of England, but data suggest it’s now far more widespread.

By mapping sequence prevalence onto total cases, we can see how the new variant is behind recent spikes
If we plot B.1.1.7 and B.1.617.2 on a common baseline, most areas show a shrinking outbreak of B.1.1.7 alongside a growing one of B.1.617.2.

What looks like "cases are flat", is probably "one going down, other going up, and it has more room to grow than the other has to shrink".
Read 20 tweets
23 May
A side note: I’ve seen it said that the media is putting a positive spin on things despite SAGE members and other experts being much more worried.

This is a surprise to me, since the people we speak to for our reporting and quote in our articles are SAGE members and experts 🤔
We probably spent 20+ hours each reporting these stories, running well into Friday night and Saturday. This involved speaking to experts in immunology, epidemiology and broader public health, including the very people who did the analysis on vaccine efficacy and transmissibility.
I get why some think there’s not sufficient alarm. 150k have died in the UK, and a reluctance to act early has played a part.

But to accuse us of spinning when we’re working our asses off to get data & expert comment to the public as quickly as possible, is quite something.
Read 6 tweets

Did Thread Reader help you today?

Support us! We are indie developers!


This site is made by just two indie developers on a laptop doing marketing, support and development! Read more about the story.

Become a Premium Member ($3/month or $30/year) and get exclusive features!

Become Premium

Too expensive? Make a small donation by buying us coffee ($5) or help with server cost ($10)

Donate via Paypal Become our Patreon

Thank you for your support!

Follow Us on Twitter!

:(