I think this deserves an explanation: why is it that countries that have already completed their epidemics with Alpha (or similar variants) might have an easier time with Delta than the UK, which was still in the process of opening up when Delta hit? 1/n
The answer has all to do with “overshoot”. For most epidemiological concepts there is an @AdamJKucharski thread to go with them, and overshoot is no exception, so I’ll leave you to explore here if you’d like a reminder of how this works: 2/n
Now for the purposes of this illustration, let’s assume we have two variants:
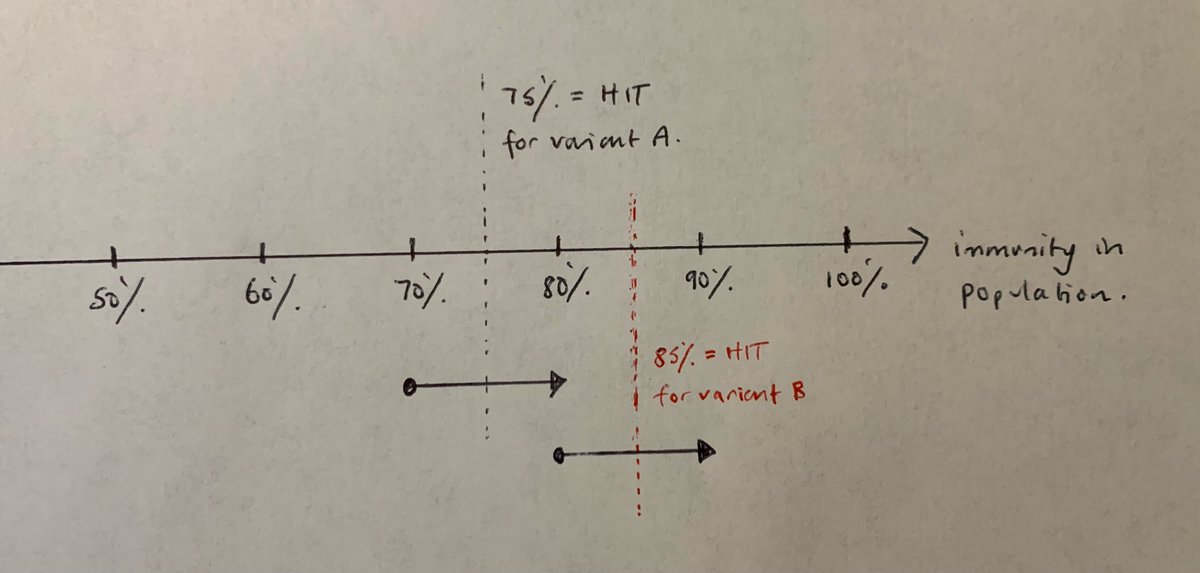
A, which has R0 of 4.0 and therefore -in a simple model- a herd immunity threshold (HIT) around 75%,
and B, which is 67% more transmissible than A, and so has R0 of 6.7, and HIT of ~85%. 3/n
To start with, variant A is dominant, and after a successful vaccination campaign the city of Bigpharmia (h/t @BristOliver again) has reached a population immunity level of 70%, just shy of the HIT for variant A of 75%. They decide to open up, and incur a small exit wave. 4/n
The size of that exit wave is governed by the distance between their current immunity level, and the HIT. R will be above 1, and hence cases rising, until immunity reaches the HIT, when R will come down to 1. But cases don’t stop there, they keep going – albeit with R<1, 5/n
…and case rates will fall until they become negligible. For relatively small waves that aren’t too near 100% immunity, the wave will tend to be roughly symmetric around the HIT i.e. for every 1% that you start below the HIT, you end up overshooting by about 1% above it. 6/n
So in our example here, Bigpharmia would open up at 70% immunity, and its exit wave would push past the HIT of 75%, coming to rest at around 80% population immunity. I’ve illustrated this in a highly sophisticated hand-drawn picture below: 7/n Image
(sorry for short delay, had to go and kill a very large spider in my daughter's bedroom!)
Now let’s suppose variant B takes over. This shifts the HIT up to 85%, and suddenly Bigpharmia is below the threshold again. So (in the absence of intervention), a new exit wave would start. The same rules apply as before, and immunity would run up to around 90%. 8/n Image
But let’s suppose that Bigpharmia had never had its first exit wave, so it was stuck at 70% immunity when variant B took over. Now it faces the challenge of opening up with 70% immunity, and a 85% HIT. That’s going to create a much bigger exit wave, and if it stayed…. 9/n Image
…symmetric around the HIT, it would keep going until pretty much everyone who was still susceptible had caught the virus. (in practice, the dynamics are a bit more complex when you approach 100% immunity, but I’m going to ignore that for simplicity here). 10/n
So we’ve ended up with an extra 10% of the population getting infected, as a result of not having completed the epidemic with the earlier, less transmissible variant A. Put another way, the exit wave for A might infect 10%, but it protects a further 10% from variant B. 11/n
Some have used this logic to argue that, with the great value of hindsight, we should have taken more risks in our opening-up in the UK, and allowed cases (& hence immunity) to grow with the Alpha variant, which might now give us a stronger position for dealing with Delta. 12/n
I’m not completely sure about that; there are complex dynamics in the UK relating to the timing of our vaccination programme, which might mean that earlier opening would still have created worse outcomes (as we’d have been infecting more vulnerable people on average). 13/n
But, whatever your view on that, it’s certainly an argument for why it might be better to “complete” our epidemic with Delta over this summer/early autumn, rather than holding out for a more perfect exit (with fewer deaths and hospitalisations) in the winter. 14/n
One of the risks with holding out is that an even more transmissible variant (or one with greater immunity escape) could appear in the meantime, and we might then be placed in the position that Bigpharmia has above, where we're facing a bigger exit wave than we thought. 15/n
Of course, if we did find ourselves in that position, there are things we could do e.g. by re-imposing moderate controls to flatten the exit wave (or split it into smaller waves), which could reduce the overshoot. But that’s challenging and has costs of its own. /end

• • •

Missing some Tweet in this thread? You can try to force a refresh
 

Keep Current with James Ward

James Ward Profile picture

Stay in touch and get notified when new unrolls are available from this author!

Read all threads

This Thread may be Removed Anytime!

PDF

Twitter may remove this content at anytime! Save it as PDF for later use!

Try unrolling a thread yourself!

how to unroll video
  1. Follow @ThreadReaderApp to mention us!

  2. From a Twitter thread mention us with a keyword "unroll"
@threadreaderapp unroll

Practice here first or read more on our help page!

More from @JamesWard73

14 Jun
I know I’m meant to be reading the details of the SPI-M papers but there’s only so many coloured curves on a chart you can stare at before they all start blending into one. I’ll re-convene on that tomorrow, but in the meantime I found something interesting in the case data. 1/7
This is plotting the growth rates for the 5-year age groups up to 30 over the last 3 weeks. You can see the explosive growth in the 20-24s and 25-29s following Step 3, and then a significant deceleration (falling growth rates) over the last few days. 2/7
On the other hand, the growth rate in school-aged children (5-9 and 10-14) looks to be resurging, having taken a short break over half term – suggesting that we might have a rocky few weeks ahead in the last few weeks of the school summer term. 3/7
Read 8 tweets
14 Jun
I promised that I would come off the fence re. plans for Step 4 by today, and I’ve left it right to the last minute, but now I will: I believe we should be delaying by 4-6 weeks. And if asked to pick a specific date, I’d go with 26 July (5 weeks on from 21 June). 1/n
(this has the marginal presentational benefit of using the government’s standard step length, so Boris can ask us all to take “one more step” on the journey back to normality). 2/n
This would normally be the point for me to launch into a long thread on the reasons why this is the best approach, and all the alternatives are sub-optimal. But I actually need to do some work today, so I’m not going to do that (if I get a chance I’ll add something later). 3/n
Read 7 tweets
11 Jun
@kallmemeg has kindly nominated me to undertake some vaccine efficacy (VE) estimates from the data in Table 6 of the latest PHE Tech Briefing. I know the number of deaths in the “double vaxxed” column has been causing concern, but I think it’s OK. 1/n
My overall conclusions are:
1)The vaccine’s efficacy vs. disease is hard to deduce from this table, as it’s sensitive to the exposure risk assumption, but a rough estimate is consistent with the PHE’s figures in Table 18 (i.e. 33% after 1 dose and 80% after 2 doses) 2/n
2)The VE vs. hospitalisation and death appears robust to different assumptions of exposure risk, and implies that the vaccines are maintaining good protection (~80%) after 1 dose, and very strong protection {>95%) after 2 doses. 3/n
Read 22 tweets
10 Jun
As you can imagine, I’ve been trying for the last few days to work out what’s going on in the case data, and why it is that our models haven’t predicted the take-off in cases over the last week. I think I’m starting to get my head around it, but it’s a work-in-progress. 1/n
In essence I think we’re still thinking too much in terms of national averages, and not quite recognising that this is a wave composed of a number of local/regional outbreaks, which are concentrated in specific age groups. This has a number of implications for modelling. 2/n
In particular I want to focus on the age-group dynamic, because I think this has been under-recognised, and has led to a couple of specific problems with the models. Let’s take a quick look at the growth rate by age group in the most recent case data: 3/n
Read 30 tweets
9 Jun
There’s something a bit odd in that CO-CIN data I tweeted on Monday, showing shorter stays in hospital more recently. The problem is, if I use the full dataset to predict the number of inpatients, I get more than there actually were in wave2. 1/n
Let’s try that to start with, using a model scenario (I’ll bring in real data in a bit). I’m taking the worst scenario from my recent model update, which has very similar peak hospitalisations to the actual peak in Jan 2021. 2/n
I can run that admissions curve through a simple model which combines it with the CO-CIN data for length of stay, and predicts what the inpatients curve would have been. In fact I get two curves: one using the “recent” data (yellow), and one for the whole dataset (blue): 3/n
Read 10 tweets
7 Jun
thanks to the person who pointed me towards this report: assets.publishing.service.gov.uk/government/upl… (you know who you are!) - lots of interesting data. In particular it does support the anecdotal evidence that average length of stay in hospital is shorter in recent admissions: see this chart 1/3
...and compare to the older data in the chart below. So after 10 days, about 75% have been discharged in the recent data, compared to 40% in the older data. (but note deaths are lower in the recent data, which slightly offsets the benefits for hospital bed occupancy). 2/3
what's not entirely clear to me is whether this is just the result of a lower average age of patients being admitted - see below- (and would reverse if more older cases arrived), or whether it says something more fundamental about the progression of covid disease with Delta. 3/3
Read 4 tweets

Did Thread Reader help you today?

Support us! We are indie developers!


This site is made by just two indie developers on a laptop doing marketing, support and development! Read more about the story.

Become a Premium Member ($3/month or $30/year) and get exclusive features!

Become Premium

Too expensive? Make a small donation by buying us coffee ($5) or help with server cost ($10)

Donate via Paypal Become our Patreon

Thank you for your support!

Follow Us on Twitter!

:(