TODAY’S (6月17日) #COVID19 update for #Taiwan 🇹🇼
📈175 local + 0 imported cases 📉trend
📈19 deaths 📉trend
📉0.5% test positive rate
📈3.8% case fatality rate (CFR) since May 1
🧪36k tests 📈capacity
💡Good to see concurrent downward trends in cases, deaths, and positivity. 1/6
📈175 local + 0 imported cases 📉trend
📈19 deaths 📉trend
📉0.5% test positive rate
📈3.8% case fatality rate (CFR) since May 1
🧪36k tests 📈capacity
💡Good to see concurrent downward trends in cases, deaths, and positivity. 1/6

DAILY CASES REPORTED (pink bars) and their 7-DAY AVERAGE (pink line), where each day is the mean of itself and the previous six. Reported DEATHS (crimson red bars) are seen at the bottom. For deaths from May 1-June 17:
🔴64% are ≥70
🔴26% are 60-69
🔴10% are 30-59 years old
2/6
🔴64% are ≥70
🔴26% are 60-69
🔴10% are 30-59 years old
2/6

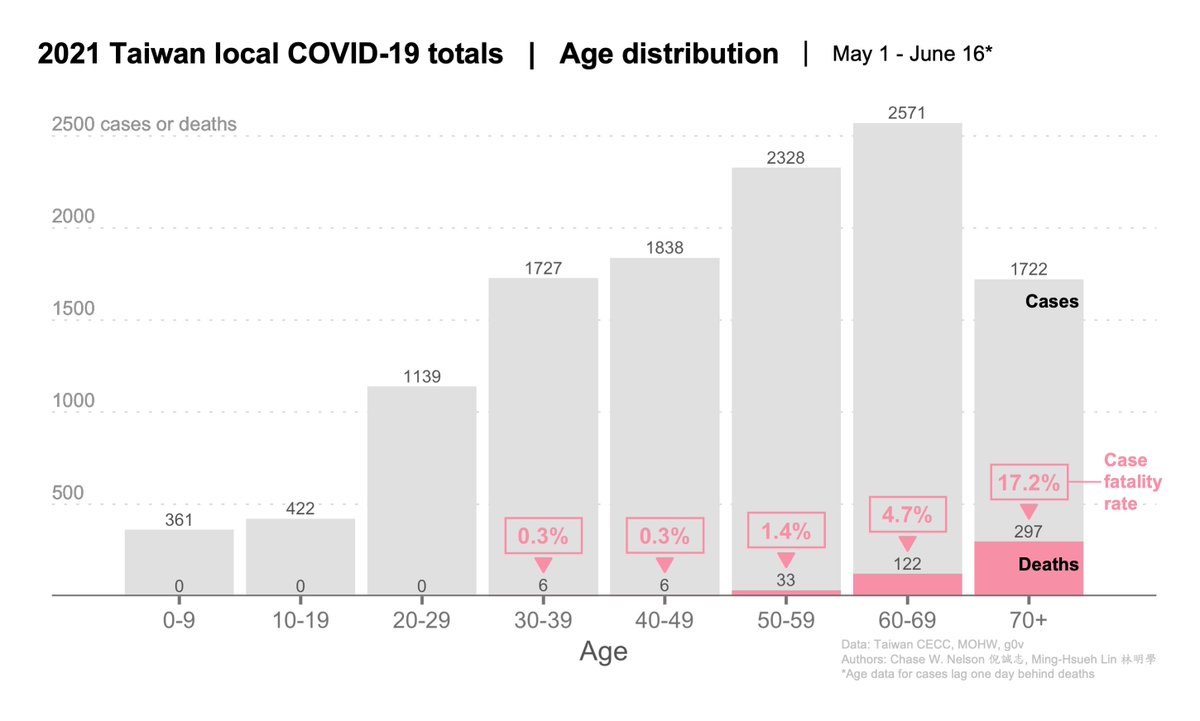
AGE DISTRIBUTION OF CASES. Local cases from May 1-June 16 (age data for cases lag by a day), including those with missing locations. Only a single category is provided for ages >70, which constitute 14% of all cases. ➡️data.cdc.gov.tw/en/dataset/ags… 3/6 

Our local case fatality rate for May 1-June 16 is 3.8%—higher than the world average of 1-3%. This is at least partly due to a disproportionate number of older cases. This is likely to climb a bit more because deaths lag 2-3 weeks behind cases. 4/6 

CASES & DEATHS and their 7-DAY AVERAGE BY AGE for May 1-June 16 (latest age-matched data available). All frankly good news. Keeping eyes peeled for 1) a spike 1-2 weeks after Dragon Boat, when some traveled of necessity and 2) workplace clusters due to lack of #WorkFromHome. 5/6 

If you’re like me and think that @Canon #台灣佳能 in #Taiwan locking up foreign workers in packed dorms while forbidding them to go outside or talk sounds like a GROSS HUMAN RIGHTS VIOLATION and HEALTH RISK, please tell the government to end this NOW. 6/6
https://twitter.com/chasewnelson/status/1405127133605732355
• • •
Missing some Tweet in this thread? You can try to
force a refresh


