
Evolutionary geneticist studying HPV | Musician & writer | Taiwan 🇹🇼 & Michigan 🇺🇸 | Views my own

 Favoring a wildlife origin (scenario A), I found the following most compelling:
 First, consider the population of Taiwan, stratified by age and vaccination status. The single largest group is 30-49 year-olds with 3 doses (dark green).


 DAILY CASES REPORTED (pink bars) and their 7-DAY AVERAGE (pink line), where each day is the mean of itself and the previous six. DEATHS (crimson red bars) at the bottom. THRILLED to have room for the chart legend specifically in the top right quadrant! 2/6

 DAILY CASES REPORTED (pink bars) and their 7-DAY AVERAGE (pink line), where each day is the mean of itself and the previous six. DEATHS (crimson red bars) at the bottom.
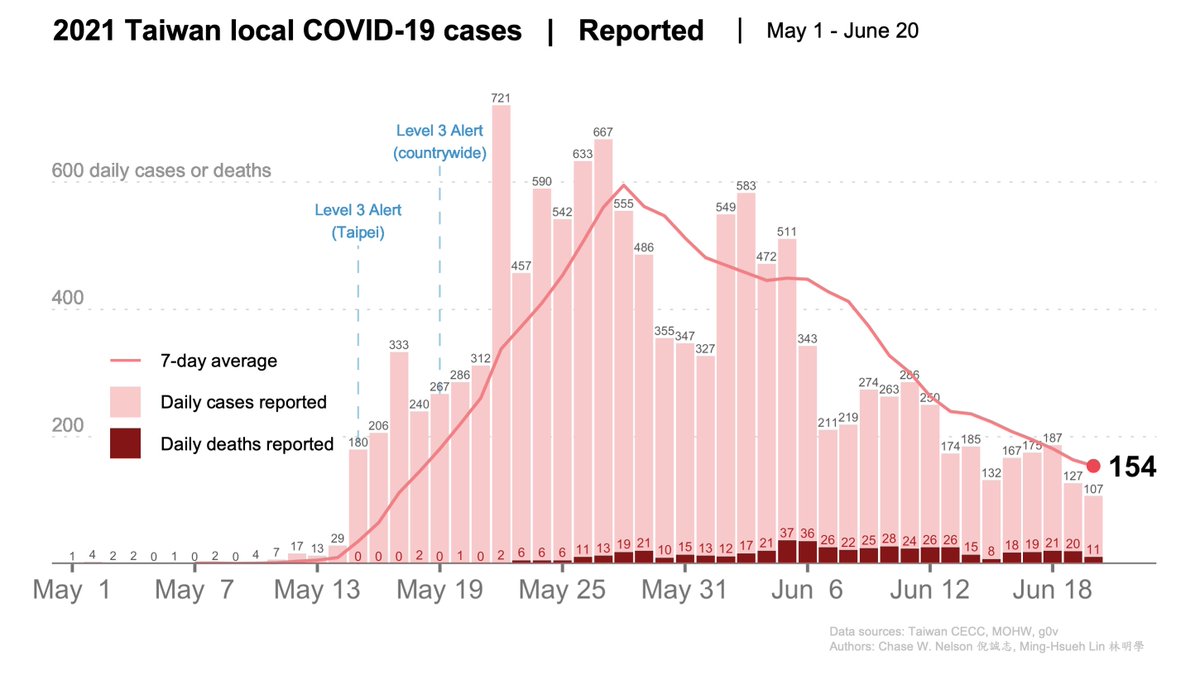
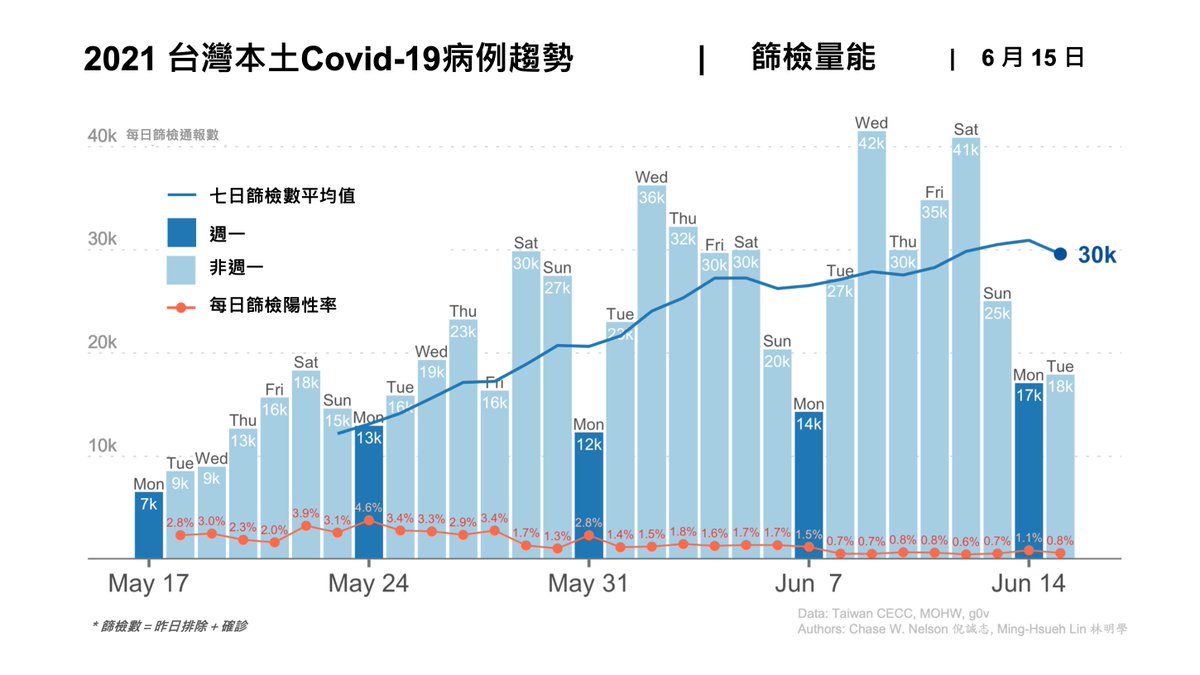
 2️⃣ 篩檢量能的趨勢,並與確診數做比較列出陽性率 2/6
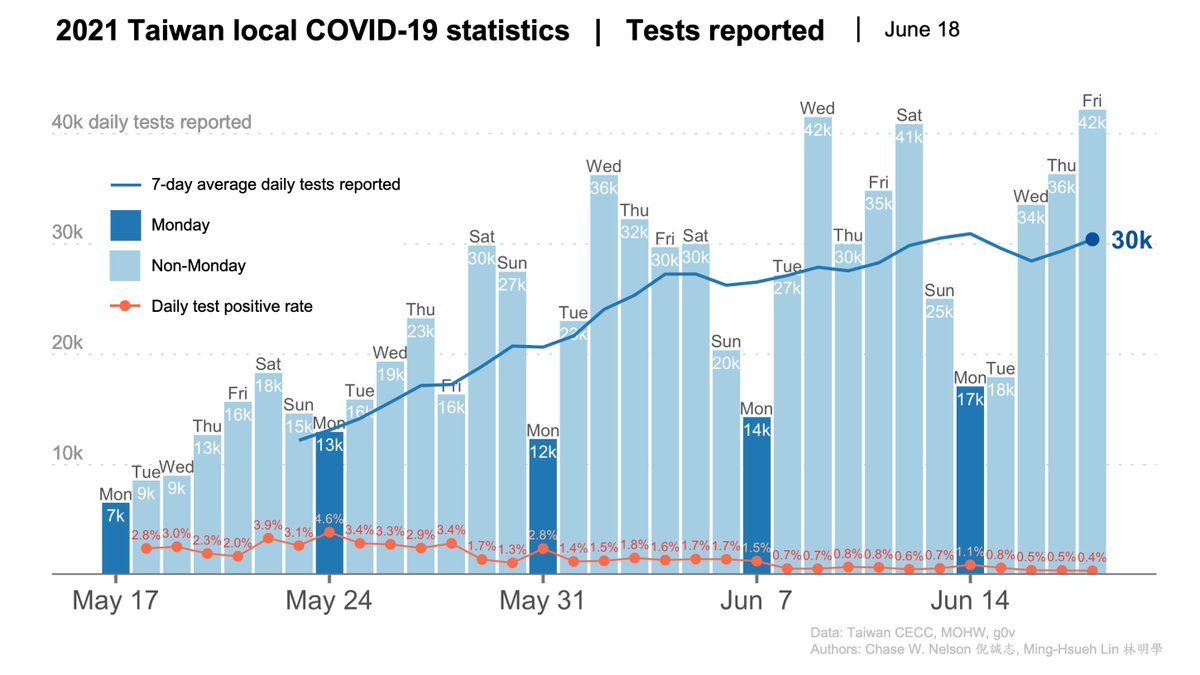
 DAILY TESTS REPORTED. Daily counts are subject to bias, with the fewest tests consistently reported on Mondays. This emphasizes the importance of 7-day averages, not daily values. The mean seems to be slowly rising, even though today's mean dipped. 2/6
 DAILY CASES REPORTED (pink bars) and their 7-DAY AVERAGE (pink line), where each day is the mean of itself and the previous six. DEATHS (crimson red bars) are seen at the bottom.
 DAILY CASES REPORTED (pink bars) and their 7-DAY AVERAGE (pink line), where each day is the mean of itself and the previous six. Reported DEATHS (crimson red bars) are seen at the bottom. For deaths from May 1-June 17:
 DAILY CASES REPORTED (pink bars) and their 7-DAY AVERAGE (pink line), where each day is the mean of itself and the previous six. Reported DEATHS (crimson red bars) are seen at the bottom. For deaths from May 1-June 16:
 2⃣ 確診數趨勢 (當日公布數版本)
 DAILY CASES REPORTED (pink bars) and their 7-DAY AVERAGE (pink line), where each day is the mean of itself and the previous six. Reported DEATHS (crimson red bars) are seen at the bottom. For deaths from May 1-June 15: