Will take this ON 😀 Straddle and strangle selling has higher POP, true. But if that method has that small risk of a single event blowing up your capital, you will blow up at one point of time unless you manage position size conservatively
1. Vol when it goes up will cover the time decay
2. Volatility is mean reverting,yes. But how does one know other than guessing that it will mean revert from here ? high vols are no guraantee for mean reversion
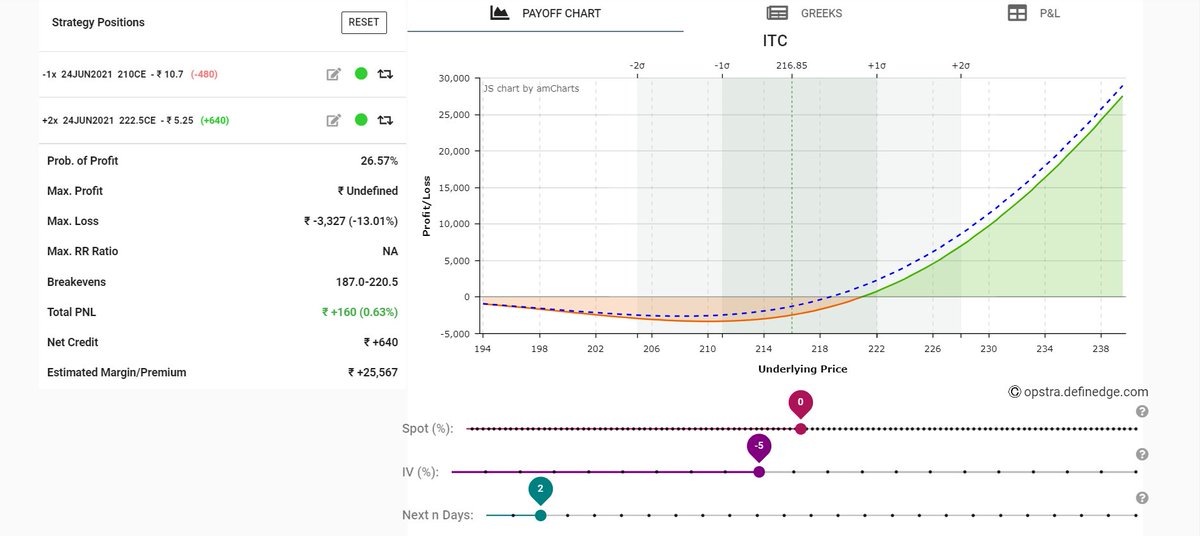
2a. At low IVs, the probability of long options succeeding increases exponentially. Why would I sell ?
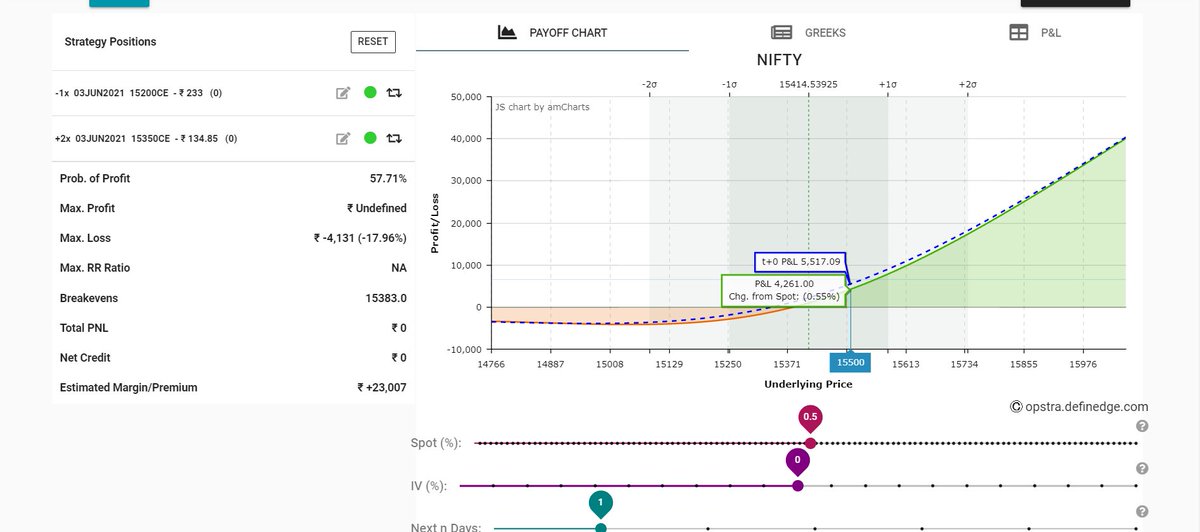
The point is, there is a time for selling and a time for buying. Being fixated on one and assuming that to be the better solution is not a good strategy

• • •

Missing some Tweet in this thread? You can try to force a refresh
 

Keep Current with Subhadip Nandy

Subhadip Nandy Profile picture

Stay in touch and get notified when new unrolls are available from this author!

Read all threads

This Thread may be Removed Anytime!

PDF

Twitter may remove this content at anytime! Save it as PDF for later use!

Try unrolling a thread yourself!

how to unroll video
  1. Follow @ThreadReaderApp to mention us!

  2. From a Twitter thread mention us with a keyword "unroll"
@threadreaderapp unroll

Practice here first or read more on our help page!

More from @SubhadipNandy16

15 Jun
Since I am showing a lot of technical patterns on my charts, here is a thread on patterns I wrote some years ago.
Go to book : Technical analysis of stock trends by Edwards and Magee
You will probably hear a lot of traders saying that markets have changed, gone electronic etc thus patterns do not work. Understand this, patterns are made by crowd behaviour. The crowd and it's emotions remain the same.
Plus if something has stood the test of time for over a hundred years, I will trust it more than some current fad #lindy_effect . So before you go into codes and stuff, it's always better to learn the classical analysis of the markets
Read 4 tweets
15 Jun
If you remember, my original target in Zee was 235-240. One move of the 220ce from 10 to 19 done, out of trade. Will now scalp, keeping a positional trade a bit dicey
Now switching to 230CEs
expecting one small dip to re-enter
Read 5 tweets
8 Jun
Things are getting increasingly interesting. Now NIFTY fut in VolXplosion. As usual, I have marked the last few times this signal came, you can check how Nifty behaved after that
Let me show something else on Nifty fut. This is the " extreme top bottom" marker. A play on MFI, code is open for Quantifying Breakout students. This is suggesting a probable top in place . The pic shows signals over last one year. Right in green tick, wrong in red cross
In short, Nifty is extremely overheated. Does not mean it cannot go up, but one should be very very cautious here. Still no divergences on charts from momentum oscillators
Read 4 tweets
31 May
We have started taking a bullish position on ITC aiming at the results tomorrow. Trade is through an options strategy with zero or minimal loss and large profits if correct. Would you like to see the trade ?
OK, here is the position. Be aware that we are already in the position and are running at a small profit
Sell 1*210CE and buy 2*222.5CE June
Call Backspread
Price stays same, IV falls 5% post results
Read 13 tweets
30 May
Nifty fut and BankNifty fut : positional structure analysis through classical technical analysis. This does not mean the indices will go up straight from tomorrow and you can buy far OTM weekly options. I am using this as the main structure to time by bullish trades
Nifty fut at All Time Highs
1. No divergences 2. Trendline brkout on price 3. Breakout on RSI 4. Breakout on MFI 5. MACD slope firmly up 6. Momentum in tandem with price
Targeting for this move. I break up the targeting as per my experience ( i know it's not classical). The BLUE line is the classical target, but I don't have that kind of time patience
Read 4 tweets
28 May
Yesterday I gave a positional Nifty options trade on @CNBC_Awaaz . The trade was :
Short 1*15200CE and Long 2*15350CE ( debit 36)
SL was 15 mins trading below 15280 ( which did not happen). If this SL was triggered, one would have lost max 20 points, meaning Rs.1500 per lot
Today I would suggest booking profits around 15500 Nifty fut. The payoff graph is given below. One should make around Rs.5000-5500 per lot.
DO NOT carry this trade overnight today. SL for today is 15 mins trading below 15450
The trade given on the SBI was long naked 415CE June ( second half of the show). This was a BTST call, so book within 9.30 whether at profit or at loss
Read 4 tweets

Did Thread Reader help you today?

Support us! We are indie developers!


This site is made by just two indie developers on a laptop doing marketing, support and development! Read more about the story.

Become a Premium Member ($3/month or $30/year) and get exclusive features!

Become Premium

Too expensive? Make a small donation by buying us coffee ($5) or help with server cost ($10)

Donate via Paypal Become our Patreon

Thank you for your support!

Follow Us on Twitter!

:(