1. Back on crop acres with new #FDD article this week. Tried to figure out what happened to the 14.4 million acres that left US crop production after 2014. farmdocdaily.illinois.edu/2021/06/where-…
2. Here is my accounting of total US crop acreage. Notice that total was pretty stable from 1998-2014 around the average of 359.4 million acres. Then down down down through 2020. Total drop after 2014 of 14.4 million acres through 2020.
3. Started analysis with acres going into and out of CRP. Anything funny going on there. The answer is yes. Should be an inverse relationship between CRP and principal crop plus prevent plant acres. This held through 2014, then both declined. What gives?
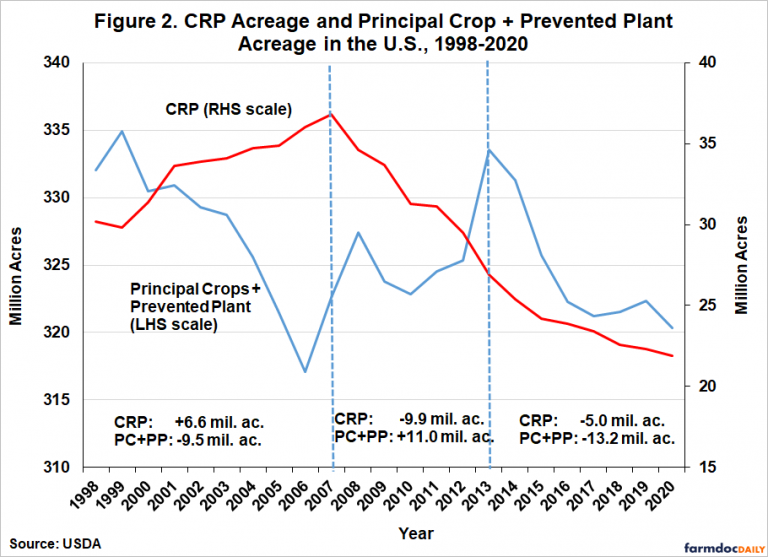
4. Fortunately USDA has done research tracking every acre of CRP ground that expired from 2013-2016. Vast majority back into crops of some kind. My conclusion: drop in principal crop acres was so big that it swamped the positive impact of acreage coming out of CRP after 2014
5. Next step was to look at where the drop in total crop acres was the biggest after 2014. As this map shows, declines in all but a handful of states. But biggest declines mainly in Great Plains states. Important clue about what happened to the missing acres.
6. So I next looked at planted acreage changes for major crops in top 10 states with loss of total crop acres between 2014 and 2020. Large drops in wheat and hay acres pretty much across the board in these states.
7. So my conclusion is that the drop in total crop acres after 2014 in the US can be mainly traced back to decline in wheat and hay acreage in the Great Plains. Not the entire story but the main story.
8. So why should anyone in the market care about this? The reason is that total size of "acreage pie" constrains acreage of all crops, including corn and soybeans. Unlikely that a big pool of additional acres is sitting out there this year to increase the size of pie.
9. But those 14.4 million acres are sitting out there and could come back into production at some point in the future.
10. My forecast of total crop acreage for 2021 after adjusting for downward bias in March numbers. From an earlier article. So I expect total crop size in June report to go up 2.8 million acres. But that is it. Will see next week!
11. Meant to also add that we don’t know exactly what happened to the crop acres that went out of production. Most likely pasture fallow or range.

• • •

Missing some Tweet in this thread? You can try to force a refresh
 

Keep Current with Scott Irwin

Scott Irwin Profile picture

Stay in touch and get notified when new unrolls are available from this author!

Read all threads

This Thread may be Removed Anytime!

PDF

Twitter may remove this content at anytime! Save it as PDF for later use!

Try unrolling a thread yourself!

how to unroll video
  1. Follow @ThreadReaderApp to mention us!

  2. From a Twitter thread mention us with a keyword "unroll"
@threadreaderapp unroll

Practice here first or read more on our help page!

More from @ScottIrwinUI

26 Feb
1. One more quick thread on the biodiesel hedging article. This one is directed to grad students and other researchers looking for interesting problems to dig into. I am asked more than you think, "How do you find interesting research topics?"
2. Well to start with, I am an applied economist. Very applied. To find interesting applied economic research problems I think you have to be engaged with the relevant industry and part of the ongoing conversation.
3. I used to do this by reading a lot of trade magazines but now I get pretty much a 24/7 flow of engagement on twitter. But there is a trick. I am interested in what people in the industry are saying and talking about, not necessarily what other academics are saying.
Read 8 tweets
26 Feb
1. Weekend Reading: Have not done one of these for awhile. This one is on a brand spanking new article coming out in Energy Economics "Biodiesel hedging under binding renewable fuel standard mandates." sciencedirect.com/science/articl…
2. Hopefully that link is in front of the paywall. I can never tell from publishers page. I really think this is a fun little article. My co-authors are my long-time partner in crime Phil Garcia and Jason Franken of Western Illinois.
3. The genesis for this article was from following trade conversation on biodiesel pricing and hedging. Always much discussion about the leading role of heating oil/diesel futures on biodiesel prices, and by implication, how one should hedge biodiesel.
Read 10 tweets
16 Oct 20
1. Weekend Reading: Just published in the AEPP (free access) with farmdoc colleagues "Coronavirus Impacts on Midwestern Row‐Crop Agriculture" onlinelibrary.wiley.com/doi/full/10.10…
2. Our main purpose in writing this paper was to show that the coronavirus pandemic simply added to the downward financial pressures on Corn Belt ag that have been building since 2014, when the long price boom ended.
3. This downward trend in returns is nicely summarized in this chart. The big soybean return in 2018 was MFP1. So any truly good news for crop farmers after 2013 was from gov't payments. Don't be put off by the x axis scale. Need to get that fixed.
Read 12 tweets
14 Oct 20
1. Very useful graphic @BrightonCap. Closest thing to hard data on COVID death rates. This measures the risk of getting COVID X risk of dying from COVID. The worst rate is 0.18% for NJ. Vast majority of states less than 0.1%, or less than 1 out of every 1,000 people.
@BrightonCap 2. I am not making this point to say anything one way or the other regarding COVID policy responses supported by people. Just interesting to me how different people react to this kind of risk but not others. So far, death risk for population as a whole is not very large.
@BrightonCap 3. Of course, this does not account for long-term health impacts to getting COVID, which are still very poorly understood. I know I don't want to take that risk if I can avoid it!
Read 4 tweets
2 Oct 20
1. Weekend Reading. With the USDA Oct Crop Production report coming up next week, thought it would be a good time to revisit this 2013 article: "Do Big Crops Get Bigger and Small Crops Get Smaller? Further Evidence on Smoothing in U.S. Department of Agriculture Forecasts"
2. The article was published in 2013 in the Journal of Agricultural and Applied Economics (the southern ag econ journal for you old timers out there). Free access here: ageconsearch.umn.edu/record/143639/
3. First want to say what a great experience it has been over the years publishing in the JAAE . I appreciate all the work the editors have done over the years. And Olga, one of my co-authors on the 2013 paper, is one of the new co-editors!
Read 16 tweets
30 Sep 20
1. Still thinking about the 255 million bushel corn stock surprise this morning. While we will never know for sure, I find it believable that the 2019 corn crop was over-estimated by that much. Some ways of thinking about it.
2. Let's start by assuming that the true size of 2019 corn crop was 13,360 mil bu, instead of the 13,620 revised number USDA released this morning. What combination of harvested acreage and yield gets us to 13,360 and does this seem sensible?
3. If we put all the adjustment down to 13,360 on harvested acreage at a yield of 167.4, then the true harvested acreage in 2019 was 79.8 mil acres not 81.3 million acres. That would be a drop of 1.5 million acres from official number.
Read 6 tweets

Did Thread Reader help you today?

Support us! We are indie developers!


This site is made by just two indie developers on a laptop doing marketing, support and development! Read more about the story.

Become a Premium Member ($3/month or $30/year) and get exclusive features!

Become Premium

Too expensive? Make a small donation by buying us coffee ($5) or help with server cost ($10)

Donate via Paypal Become our Patreon

Thank you for your support!

Follow Us on Twitter!

:(