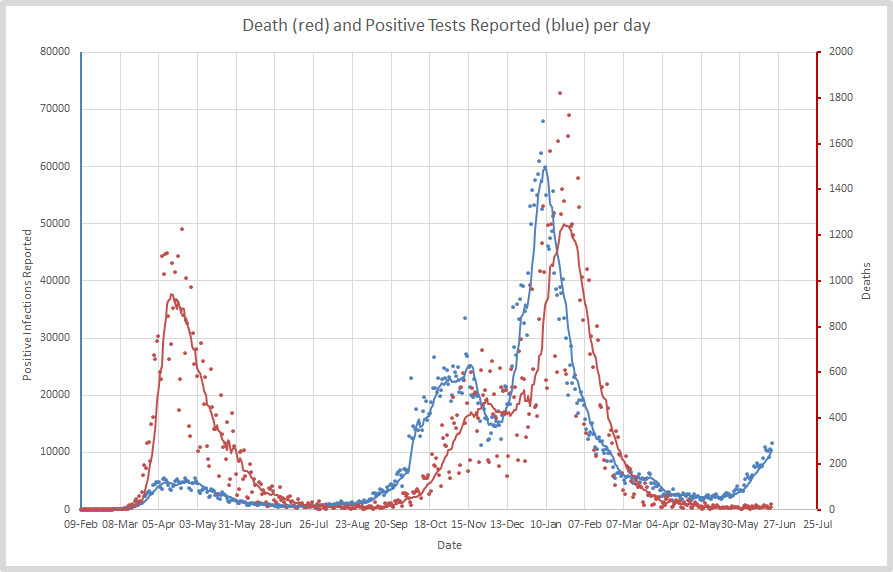
I was hoping to get away without posting a Covid stats update today. Well that isn't going to happen. Here's the overall picture (1)
I mean what can you say, as predicted deaths are now rising faster, such is the nature of exponential growth. And, likewise cases. Although todays cases are off the chart, way up (2)
13.86 deaths per day on average over the last 7 days. Up from a low of 5.71 on the 24th of May (3)
Or, if you prefer, 97 over 7 days, which is the highest since the 3rd of May (4)
And yes, I know, the last 3 points do kind of point to a new, faster rise - but its really too soon to say that as yet. But we can say deaths are rising at 6% per day on average over 7 days, and thats colossal (5)
The parallel with the end of the recovery from wave1 and the start of wave 2 is stark. Deaths started rising a little earlier this time, but the faster kick up happened 1 day earlier this time (6)
For the last couple of weeks there was some vague hope that the rise in deaths in the third wave of infection might be trivial. That is no longer a possibility. This is a significant rise in fatalities (7)
Cases are rising COLOSSALLY faster than at the start of the second wave. (8)
But the trend is similar. (9)
Deaths are in a similar scale - vaccines have probably helped here. A lot. But the rate cases are growing means deaths are rising fast, and there's another 23 days of deaths rising locked in even if we see further restrictions imposed. (10)
Infections are now doubling every 7.3 days. (11)
Interestingly R as calculated from infections is ahead (at the same point) of R from deaths - that may indicated deaths are going to continue to rise more slowly than infections have, but thats a bold assertion while deaths are still -relatively- low (12)
There is, bluntly, too much statistical noise to make that claim yet. (13)
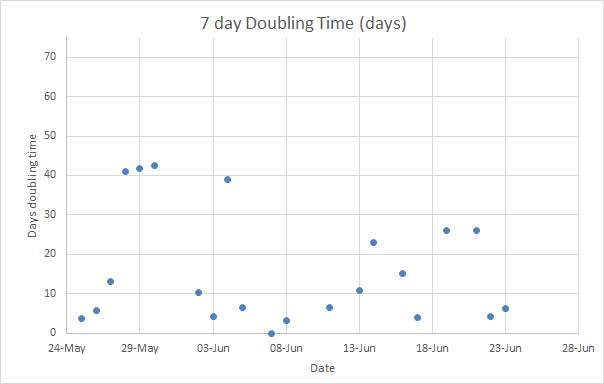
Deaths are, after the last two days figures being ghastly, doubling every 6.4 days (using 7 day rolling average and the old school rule of 72 calculation) (14)
I want something positive to say here but I've got nothing. Last time average daily cases was higher wat the 19th of February (15)
Its now only a question of how bad this can get. For every deaty there are many hospitalisations, many cases of long-covid, and many more serious illnesses. This is not a sustainable rise. We are in trouble (fin).
• • •
Missing some Tweet in this thread? You can try to
force a refresh
You may recall I've recently said that it was now, after cases had been rising for a while, that we saw a more rapid rise in Covid deaths. That would be tomorrow, if we took an equivalent day. Today deaths are more than double last Tuesday. Here's the overall picture (1)
23 fatalities today is more than double last Tuesday. Its over trend but as yet within an expected range. Look at cases and deaths on log plots, its fairly clear (2)
The 7 day running total is now 87. Thats more than double what we saw at the low point on the 24th of May, the highest since the 5th of May. (3)
Working class well educated white guy here. A few words on the #WhitePrivilege thing in this context... (1)
...yes, its true, #WhitePrivilege is unhelpful in discussions of the problems you face in education from my background. But its also just not the point. Yes, there are huge challenges, its not because you're white though (2)
...race is a proxy of class in the UK. White kids in the working class are held back by poor schools, disinterested and under resourced teachers, an anti-intellectual culture and higher education thats hostile to us (3)
Don't have time to post a full UK Covid stats thread today. But here are a few thoughts. We can, for the moment, still compare the decline in deaths, the recovery from the first with the ongoing the second peaks. For the moment. (1)
Thats a lot easier to interpret from a log graph, of course. (2)
Now its already a bit of a stretch to continue this comparison of the decline in deaths because then, as now, two things were making that a little false. Firstly, cases were starting to trend upwards. Secondly, trundling along with lower numbers made the trends noisy (3)
Deaths and cases up today. Here's the overall Covid-19 picture in the UK, I'll try and unpack whats happening in a thread (1)
If you look at recent trends for reported cases on log plots, its getting frightening. Cases are rising ever faster, and deaths are rising. 6765 cases, up from 3398 last Saturday, and 13 deaths, up from 7. (2)
Deaths have risen, relative to the same day the previous week, for 6 of the last 7 days. The exception was Monday, which of course was at the end of a bank holiday weekend, meaning the report was likely artificially low (3)
If we didn't have any new variants of Covid-19, then with the level of vaccine coverage we have in the UK we would by now have achieved herd immunity. 39.8 million 1 dose (50% efficacy), 22.4 million 2 doses (90% efficacy), starting with 1000 cases and an R0 of 5.7, we get this
But the D strain, if it is true that there is some vaccine escape, is a problem. Leaving R0 alone (and thats hopelessly optimistic, its much more infectious) and reducing efficacy to 33% and 75%, we get this curve
Lets be under no illusions - we're still in a mess because we failed to control the virus domestically (hence the Kent, or A strain) and the Indian strain (D) getting in. Without these we would now be able to get -entirely- back to normal
5274 infections and 18 deaths today. Here's the overall Covid picture in the UK now, and we're just falling off the wrong side of the knife edge (1)
Have a look at recent trends for cases and deaths on log plots. Cases are rising ever faster, and deaths are, well, rising slowly again. In a break from tradition I'll go over infections first today (2)
Here's what infections are doing - 7 day rolling average change in infections is going the wrong way. The rate infections are rising is going up, and fast. 4.82% per day, thats the worst rate of rise since the 6th of January (3)