1/
Israel: Missing COVID deaths in the Lancet paper on effectiveness.

NEW information, greater mystery. @federicolois

2/
On June 25, the last author of the Lancet paper interviewed on Israeli TV.

She reported that there were 570 COVID deaths of fully vaccinated people in Israel since the vaccination campaign began.

(fully vaccinated = “green pass”= 1 week post 2nd dose)
3/
Hebrew speakers can read a post by journalist @YaffaRaz including a video clip.

facebook.com/677092628/post…
4/
Vaccination campaign started Dec 20.

Longest possible interval for that report on TV: Jan 18 – June 25:
Recall: 570 COVID deaths of fully vaccinated

Lancet paper interval: Jan 24 – Apr 3
Recall: 138 COVID deaths of fully vaccinated (Table).

Difference: 432 deaths
5/
Periods don’t fully overlap, BUT:

~ 1 week at the beginning (not very many fully vaccinated)

Apr 4-June 25, during which there were <200 COVID deaths in Israel (presumably, mostly of unvaccinated)

Who can reconcile the numbers?

• • •

Missing some Tweet in this thread? You can try to force a refresh
 

Keep Current with פרופ' אייל שחר

פרופ' אייל שחר Profile picture

Stay in touch and get notified when new unrolls are available from this author!

Read all threads

This Thread may be Removed Anytime!

PDF

Twitter may remove this content at anytime! Save it as PDF for later use!

Try unrolling a thread yourself!

how to unroll video
  1. Follow @ThreadReaderApp to mention us!

  2. From a Twitter thread mention us with a keyword "unroll"
@threadreaderapp unroll

Practice here first or read more on our help page!

More from @prof_shahar

26 Jun
1/
UK: Delta variant:
What can we learn, and what can we not learn, from PHE reports?

About the IFR? flu at most

About vacciine effect on death? nothing Image
2/
See here IFR=0.1%, 0.3%
Why estimates differ?
Several explanations, but one we’ll need later: risk is not # death/# people. It is # deaths/# person-time.
Need to add up the number of days each person was observed to compute “rate” (epidemiology).
Risk is over people AND time. Image
3/
We don’t have time (days) for all 92,056 cases. We only have it for 11,250 (28 days per person).
Regardless, these are not all cases. By now it’s clear that 80-90% of infections are asymptomatic.
Therefore IFR must be << 0.3%
Flu. Or less.
Delta much less virulent than Alpha
Read 13 tweets
10 Jun
1/
Question: How does a dominant seasonal flu strain start simultaneously in geographically spread locations?

Spread from one location to another is unrealistic:
1) Too fast
2) No moving wave pattern.
2/
Answer: Virus arrived sooner.

Stays dormant in the body, awaiting seasonal stimulus (viral dormancy, old theory)
ncbi.nlm.nih.gov/pmc/articles/P…
3/
Support here.
Read 5 tweets
7 May
1/
Peer review (unsolicited)
Another analysis of Israel data on vaccine effectiveness. Fully vaccinated vs. unvaccinated
Observation period: Jan 24-Apr 3
Bottom line: again, likely over-estimation of effectiveness.
thelancet.com/journals/lance…
2/
Over the study period:
1)People shifted from unvaccinated to fully vaccinated.
2)Rate of infection was declining (peak Jan 20)
3/
Distribution of unvaccinated on the calendar is shifted to the left (time of HIGHER infection rate)
Distribution of vaccinated is shifted to the right (time of LOWER infection rate)
So, part of the difference between vaccinated & unvaccinated is due natural wave decline.
Read 8 tweets
1 Apr
Thread: US excess death
1/
Rough estimation of US excess deaths, Oct 2019-Sep 2020 (“flu year”)

Impact of recent winter belongs to “flu year” Oct 2020-Sep 2021

(“Flu year” avoids arbitrarily split of winter mortality between two calendar years.)

At the end: Sweden
2/
Inference derived from just 7 “flu years” (shown in rectangle) + heuristics.

Counts of all-cause deaths obtained from a table in this tweet.

Image
3/
Notice a pattern: a year of “high” mortality is followed by a year of lower/similar.

Pattern disrupted in 2017/2018, severe flu season. Should have been lower/similar to 2016/17.
Estimated flu deaths: 61,000 ImageImage
Read 10 tweets
18 Mar
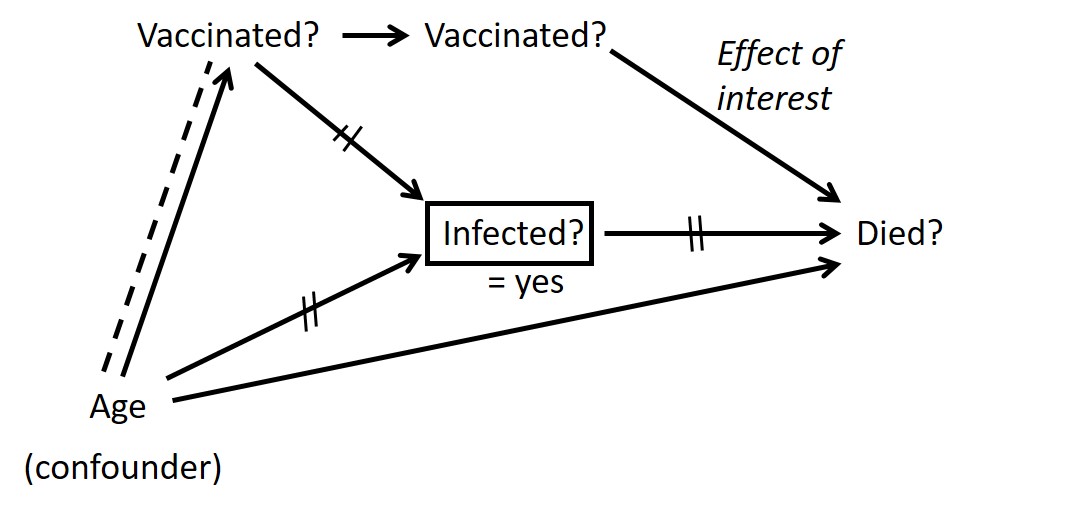
1/ Important question: Once infected, what is the effect of vaccination status on death/severity?

Here is relevant statistics from Israel data.

Disturbing observations on the early period after 1st dose. Image
2/ Table shows rate of death & severe disease, since the vaccination campaign began.

Notice that risks are higher in vaccinated than unvaccinated. That’s misleading. At any time, vaccinated were older than unvaccinated (and older, on average, in sequential vaccination groups.) Image
3/ The phenomenon is called confounding. Illustrated in a causal diagram. All comparisons are not valid. They don’t estimate effects. Image
Read 12 tweets
16 Mar
1/
Theories & evidence of bias in Israel data on vaccine effectiveness.
nejm.org/doi/full/10.10…

Theories:
1. Important endpoints (hospitalization, severe illness, death) included many patients with incidental positive PCR
2. Preferentially in unvaccinated
2/
All figures taken from Supplementary Appendix Figure S3. (The Y-axis scale seems wrong, but I assume it is just a labeling error)

Key figure: Time to hospitalization

Most patients were hospitalized within 1-2 days (!) of a first PCR swab that was found positive

Unexpected. Image
3/
Typical course much longer: symptoms->test->worsening symptoms-->hospitalization

What happened?

Many patients were likely tested in the ER. They showed up in severe enough condition, for which no outpatient PCR was done. Thus, their condition on admission was not COVID
Read 10 tweets

Did Thread Reader help you today?

Support us! We are indie developers!


This site is made by just two indie developers on a laptop doing marketing, support and development! Read more about the story.

Become a Premium Member ($3/month or $30/year) and get exclusive features!

Become Premium

Too expensive? Make a small donation by buying us coffee ($5) or help with server cost ($10)

Donate via Paypal Become our Patreon

Thank you for your support!

Follow Us on Twitter!

:(