I’m honestly not liking this case data much at all. While the modeller in me is happy that the growth rates in different age groups are, for once, moving consistently in the same direction, I just wish that direction wasn’t up. 1/6
Looking in a bit more detail, we can see growth continuing to accelerate in school-age children (5-14s)… 2/6
And the young adults (15-29) are starting to accelerate (gently) again, after a period of consistent growth 3/6
The 30-59s are continuing their own upward drift on growth rates… 4/6
And even more worryingly, we can see the first signs of a pickup in growth in the 60-79s. 5/6
The only saving grace is that there’s not much change yet in the 80-somethings, and the 90+ (which is volatile due to low case numbers) are on a downward swing. Let's hope that continues - but given the patterns in the other age groups, I'm not confident that it will. 6/6
• • •
Missing some Tweet in this thread? You can try to
force a refresh
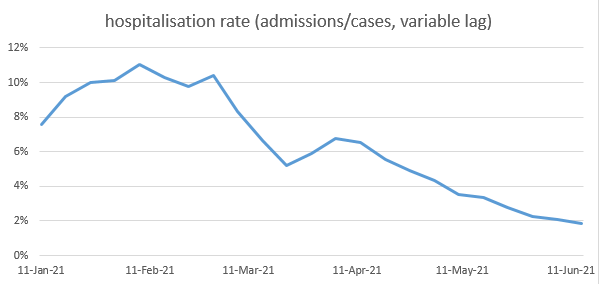
I’m not going to comment on today’s case data, because the message hasn't changed, and I don’t want to spoil an otherwise positive evening. But case data only really matters if it causes bad medical outcomes, and here the news may be a bit better. 1/n
The ratio of hospitalisations to cases has been dropping over the last few months – mostly due to vaccines. (the main effect of vaccines is to stop people getting infected, but for those who do get infected, they also reduce the chances of going to hospital or dying). 2/n
[note: to calculate this ratio, we need to compare hospitalisations to cases a few days earlier, and there’s some debate as to how long a lag to use. I’ve used lags from this recent ONS study ons.gov.uk/releases/coron…, but I get similar results with different assumptions] 3/n
So R is staying stubbornly high in England, and maybe even drifting upwards. Why is this? I’m not really sure, but as usual I think the age-stratified case data is the first place to look for clues. And the changing growth probably isn’t quite where you’d expect it to be. 1/7
Your first suspects might be unvaccinated young adults, out partying and watching the football? Well, their case rates continue to be high and growing, but R seems to have settled down to a new level around 1.3, so it’s not them that’s caused any recent uplift in R. 2/7
Your next suspects might be schoolchildren – we know they spiked up about a week ago, and again growth continues, but there isn’t strong acceleration (although maybe a bit in the 10-14s). Still, there could be a mix effect happening here: 3/7
if you're using PHE's latest analysis of Secondary Attack Rates to work out an advantage for Delta vs. Alpha, it's worth looking at table 7, as well as table 5. while table 5 suggests the advantage has fallen to +35%, table 7 suggests it's probably still 40-45%. why is this?
table 7 splits out the data into household contacts (which imply an advantage for delta of 40%) and non-household contacts (advantage 43%). If you're wondering how the combined (household and non-household) figure can show an advantage of only 35%, it's because delta has...
...a higher proportion of non-household contacts, and these tend to have lower SARs. the most obvious explanation for this is that delta's cases have a lower average age than alpha's, and hence are more sociable, with more non-household contacts.
If you're looking for a source for the surprisingly large number of cases reported in England today, I'd focus on school-age children. For example, this is the case series for 5-9 year-olds:
... and here are 10-14 year-olds:
there is continued growth in the 15-29 year old groups as well, but I'd say it's more in line with existing trends, rather than starting a new one.
So here’s an interesting stat from the case data: over the last month, the case rates in England for men and women have been roughly the same. Which is unusual. (short thread, with thanks to @RufusSG for accidentally prompting me to look at this)
Over the last year, there has been a noticeable (c. 10%) bias towards higher case rates in women. Why is that? I’m not sure. Are women more sociable? More likely to work in key-worker roles? (health/care, retail etc.) Or just more likely to get a test when they are ill?
We can get a bit more insight by looking at the ratio by age group: it’s roughly the same in under-15s, biased towards women in working-age groups (15-65), towards men in the younger retired groups (65-85) and back to women in the elderly (85+).
I’ve updated the model with all the latest data, and it’s mostly good news – at least for what happens over the next few months. There might be a bit of a ‘sting in the tail’ in the winter, but I think there are ways of dealing with that. Summary conclusions as follows: 1/
1. In my central case, the summer 2021 wave should be relatively small compared to previous waves (peaking around 5k hospitalisations per week) 2. Even in downside scenarios with higher R0 for Delta or a larger Step 4, there should be little risk of overwhelming the NHS 2/
3. However, opening earlier than 19th July would significantly increase those risks, and is not recommended 4. Assuming things go well in the summer (i.e. with a small wave), we may yet face the challenge of finding a few more % points of immunity in the autumn. 3/